Global S&T Development Trend Analysis Platform of Resources and Environment
| In 2019, oil and lease condensate proved reserves were flat; natural gas reserves declined | |
| admin | |
| 2021-01-22 | |
| 发布年 | 2021 |
| 语种 | 英语 |
| 国家 | 美国 |
| 领域 | 地球科学 |
| 正文(英文) | 
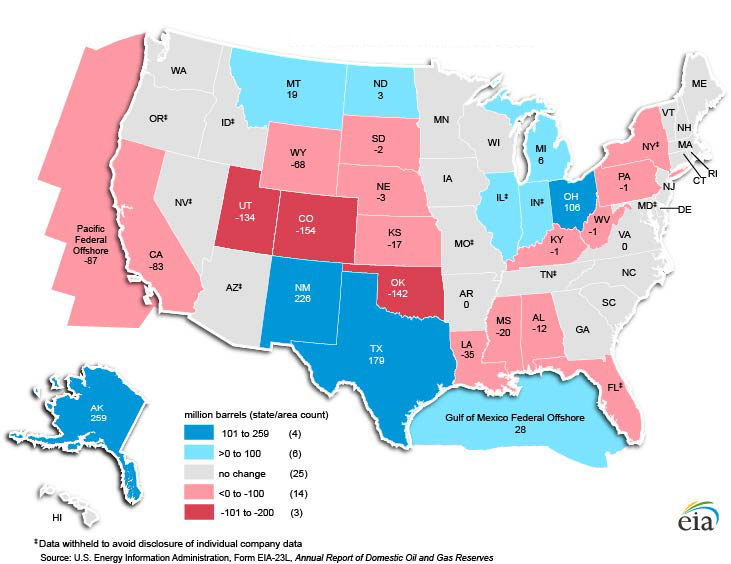
Source: U.S. Energy Information Administration, Proved Reserves of Crude Oil and Natural Gas in the United States, Year-End 2019
In 2019, proved U.S. reserves of crude oil and lease condensate increased by 0.1%, and proved natural gas reserves declined by 1.9%, according to the U.S. Energy Information Administration's (EIA) recently released Proved Reserves of Crude Oil and Natural Gas in the United States, Year-End 2019 report. Proved reserves of oil and natural gas each rose annually in the United States by at least 9% in the previous two years (2017 and 2018). Proved reserves are those volumes of oil and natural gas that geological and engineering data demonstrate with reasonable certainty to be recoverable in the future years under existing economic and operating conditions. Lower crude oil prices in 2019 caused many operators to revise their total proved reserves estimates downward even though proved reserves from extensions and discoveries increased slightly. Operators in Alaska increased their proved reserves of crude oil and lease condensate by 259 million barrels in 2019, the largest net increase of all states. New Mexico had the second-largest net increase at 226 million barrels, and Texas had the third-largest increase at 179 million barrels. The most substantial increases in crude oil and lease condensate reserves in New Mexico and Texas came from development activity in the Permian Basin. The largest net decrease in proved reserves of crude oil and lease condensate in all states in 2019 was in Colorado: a decrease of 154 million barrels. Oklahoma and Utah had the second- and third-largest decreases at 142 million barrels and 134 million barrels, respectively. 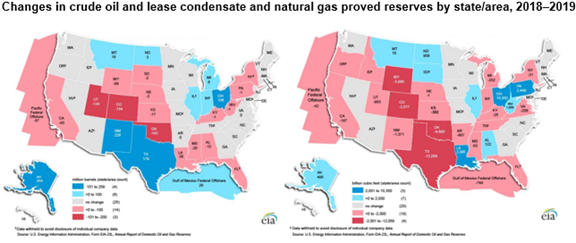
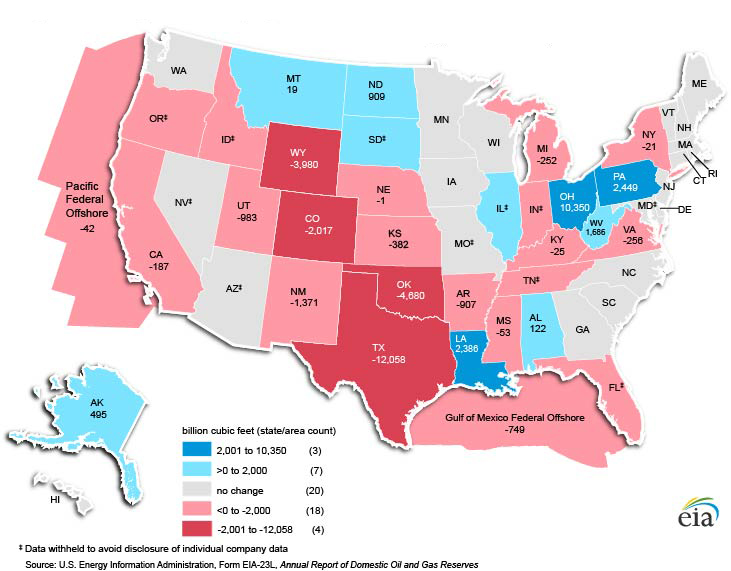
Source: U.S. Energy Information Administration, Proved Reserves of Crude Oil and Natural Gas in the United States, Year-End 2019
Note: Click to enlarge left and right maps. Natural gas prices also fell in 2019, leading to lower proved natural gas reserves. The largest 2019 decline in proved reserves of natural gas on an annual basis in all states was in Texas: a decrease of 12 trillion cubic feet (Tcf). The price drop at the Henry Hub resulted in reductions of proved natural gas reserves in the large shale gas plays of Texas—Eagle Ford, Barnett, and Bossier. The second-largest decline was 4.7 Tcf in Oklahoma. The largest net increase in proved reserves of U.S. natural gas in 2019 was in Ohio at 10.4 Tcf—the result of continuing development of the Utica/Pt. Pleasant shale play in the Appalachia Basin. Pennsylvania had the second-largest net increase at 2.4 Tcf in 2019, and Louisiana had the third-largest net increase at 2.4 Tcf. Development of the Marcellus and Haynesville shale gas plays outpaced the downward impact of the natural gas price decline. Principal contributor: Steven Grape Tags: reserves, natural gas, liquid fuels, crude oil, oil/petroleum, map |
| URL | 查看原文 |
| 来源平台 | U.S. Energy Information Administration |
| 文献类型 | 新闻 |
| 条目标识符 | http://119.78.100.173/C666/handle/2XK7JSWQ/312056 |
| 专题 | 地球科学 |
| 推荐引用方式 GB/T 7714 | admin. In 2019, oil and lease condensate proved reserves were flat; natural gas reserves declined. 2021. |
| 条目包含的文件 | 条目无相关文件。 | |||||
| 个性服务 |
| 推荐该条目 |
| 保存到收藏夹 |
| 查看访问统计 |
| 导出为Endnote文件 |
| 谷歌学术 |
| 谷歌学术中相似的文章 |
| [admin]的文章 |
| 百度学术 |
| 百度学术中相似的文章 |
| [admin]的文章 |
| 必应学术 |
| 必应学术中相似的文章 |
| [admin]的文章 |
| 相关权益政策 |
| 暂无数据 |
| 收藏/分享 |
除非特别说明,本系统中所有内容都受版权保护,并保留所有权利。


修改评论