Global S&T Development Trend Analysis Platform of Resources and Environment
| Five stories from new voluntary offsets data | |
| admin | |
| 2021-03-23 | |
| 发布年 | 2021 |
| 语种 | 英语 |
| 国家 | 国际 |
| 领域 | 气候变化 |
| 正文(英文) |  Photo by Aaron Burden on Unsplash The recent uptick in interest for voluntary offsets invokes certain concerns, but it also comes with a few benefits. One of these is the push for more transparency. A new public database tracking information about voluntary offsets from the four largest standards was launched by Trove Intelligence. It adds to similar platforms such as those maintained by Climate Focus and AlliedOffsets. Below are the five main lessons that this new data can teach us. 1. It’s The Great Flood The first lesson is that there is still a large supply of credits out there. Of all the voluntary units issued since offsets began being “a thing”, 44% are still available today. That’s over 360 million credits, or four times the number of offsets used in 2020, which was a record year. Not only is this high already, but the surplus is increasing. Concretely, this means that every year, there are more carbon credits issued than companies are using as part of their voluntary climate commitments. 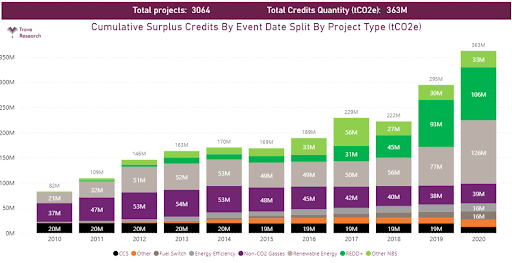 Source: Trove Intelligence (2021) What am I looking at? This graph shows the accumulation of credits over time. These are credits that were created, but which nobody bought. It also shows which project types created these credits, e.g. forestry, renewable energy, etc. The last bar to the right shows the total number of credits available in 2020, broken down by project type.2. Somebody forgot to invite the LDCs For all the talk about carbon markets channelling finance to the poorest countries, there is no LDC in the top 10 of countries that have most benefited from finance through offsets. The three countries from which the most credits have been sold are India (19% of all offsets used), the US (18%) and China (13%). The same countries, in the same order, are also the top three countries with the most offsets still available on the market. 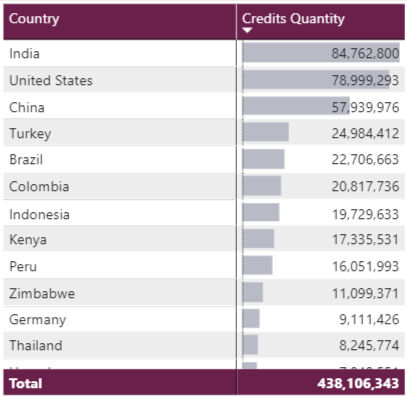 Source: Trove Intelligence (2021) What am I looking at? This table essentially answers the following question: where did the offsets used by companies come from? This means it does not rank countries by how many offsets they created, but rather by how many offsets created within their territory have been used by companies. Note that the governments themselves are not selling the credits, it is simply a way of showing where the emission reduction activities for which offsets were sold are taking place.3. Speaking trees to power The most widely used types of offsets are from the power and land-use and forestry (LULUCF) sectors, more specifically from renewable energy and avoided deforestation (REDD+) projects. Together, they account for 65% of all credits used until now – with 44% coming from renewable energy, and 21% from REDD+. This is consistent with the fact that these project types represent a dominant share of all issued offsets to date. Many renewable energy credits were issued by old projects, as large-scale renewable electricity projects were able to create large volumes of credits. These projects are no longer eligible to register with the main voluntary market standards. REDD+ and other land-use credits, on the other hand, are becoming more and more popular, despite their significant shortcomings related to measurement uncertainties and the lack of permanence. 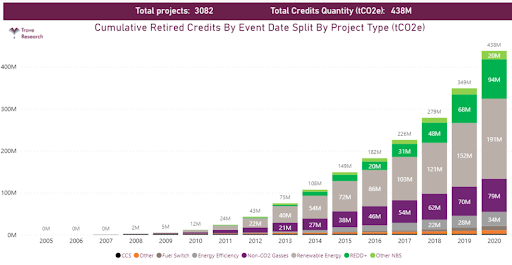 Source: Trove Intelligence (2021) What am I looking at? This graph shows the accumulation of used credits over time. As time passes, more and more credits have been used by companies. The last bar in 2020 shows all the credits which have been used to date, broken down by project type.4. Best before: see packaging It’s clear that there are still many old credits available for sale. But one popular argument against regulation continues to be that “the market” will self-regulate. Is it happening? No. In 2020, half of the credits used were at least 5 years old. Going forward, the idea of setting expiry dates on carbon credits needs to be more seriously considered. 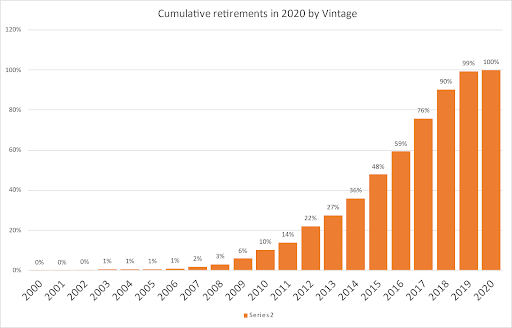 Source: Trove Intelligence (2021) What am I looking at? This graph shows what share of offsets used in 2020 was older than a certain age. For example, the share in 2015 is at 48%, which means that 48% of credits used in 2020 were for emission reductions that happened in 2015 or earlier.5. One standard to rule them all Hopefully, this is just a bad title, as diversity and healthy competition are needed to raise the level of quality of carbon credits. But today, the US-based Verra by far dominates the market. Nearly 70% of all offset credits used until now have been issued by Verra. Gold Standard comes in second with only 17%. The other two North American standards covered in this database issue a similar volume of units to that of Gold Standard, but most are used for compliance in California, rather than as voluntary offsets. 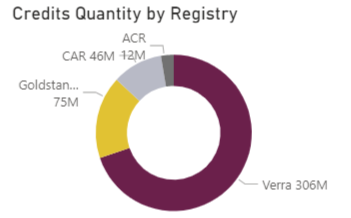 Source: Trove Intelligence (2021) What am I looking at? This chart shows how many of the offsets used by companies up to 2020 were created under a certain standard.Conclusion The main lesson to take away from this is that the voluntary carbon market is still not really delivering on its objectives. The poorest countries have not significantly benefited from the system. In addition, a large number of offsets used by companies are old and come from large-scale projects with questionable additionality/vulnerability and permanence. Finally, the dominant position of a single standard that is supposed to guarantee the integrity of the system means that a lot of responsibility is shared among a few people. This could risk the stability and reputation of the system especially if it was to grow significantly. Going forward, private sector finance has a crucial role to play, and carbon credits could play a role in channelling this finance. But some elements of the voluntary market need to be reformed, and alternative claims to offsetting must be encouraged and adopted. *Technical clarification on the data* All the numbers presented here were drawn from the Trove Intelligence database which collects information from the registries of the VCS, CAR, ACR, and GS. These numbers were cross-checked for consistency with those of the Climate Focus database, where possible. The Trove Intelligence database includes units issued by ACR and CAR for use under the California cap-and-trade, but clearly separates cancellations (units used for compliance) from retirements (units used for voluntary purposes). All references to “uses” of offsets in this article relate to retirements, i.e. voluntary uses, because cancelations are not part of what is commonly considered the voluntary market. Downloads
Five stories from new voluntary offsets data (PDF)
|
| URL | 查看原文 |
| 来源平台 | Carbon Market Watch |
| 文献类型 | 新闻 |
| 条目标识符 | http://119.78.100.173/C666/handle/2XK7JSWQ/319720 |
| 专题 | 气候变化 |
| 推荐引用方式 GB/T 7714 | admin. Five stories from new voluntary offsets data. 2021. |
| 条目包含的文件 | 条目无相关文件。 | |||||
| 个性服务 |
| 推荐该条目 |
| 保存到收藏夹 |
| 查看访问统计 |
| 导出为Endnote文件 |
| 谷歌学术 |
| 谷歌学术中相似的文章 |
| [admin]的文章 |
| 百度学术 |
| 百度学术中相似的文章 |
| [admin]的文章 |
| 必应学术 |
| 必应学术中相似的文章 |
| [admin]的文章 |
| 相关权益政策 |
| 暂无数据 |
| 收藏/分享 |
除非特别说明,本系统中所有内容都受版权保护,并保留所有权利。


修改评论