| 英文摘要 | Defense Acquisition Trends 2020: Topline DoD Trends
CSIS Briefs October 8, 2020
The Issue
This paper, the first in our 2020 report series, presents the topline contracting trends of the Department of Defense (DoD) for Fiscal Year (FY) 2019, as available in the Federal Procurement Data System (FPDS). This year’s study focuses on whether there is an ongoing transformation in the defense acquisition system in response to the 2018 National Defense Strategy, along with the use of new acquisition approaches such as Middle Tier of Acquisition and Other Transaction Authority Agreements. Furthermore, this study looks at whether there is an emerging new paradigm for the development of major weapon systems. Finally, this report includes an analysis of the topline DoD contracting trends.
Fast Facts:
- Defense contract obligations increased 4 percent in FY 2019 and accounted for 55 percent of DoD Total Obligation Authority (TOA), the third-highest level over the last twenty years.
- Technology development has continued shifting towards Other Transaction Authorities (OTA) and away from traditional acquisition approaches.
- Trends were mixed in platform portfolios corresponding to the 2018 National Defense Strategy priorities (Air and Missile Defense; Nuclear; Space; Cyberspace; and Command, Control, Communications, Computers and Intelligence, Surveillance, and Reconnaissance (C4ISR)). Electronics, Comms, and Sensors continued growing steadily, while Space Systems rebounded last year as Air & Missile Defense continued its whipsaw between growth and decline over the course of the defense contracting rebound.
- There has been a recovery overall in the development pipeline for major weapon systems, particularly in the middle stages; however, there has not been a recovery in the later stages.
Introduction
Having incorporated the recently released FY 2019 DoD contract data into CSIS’s long-running review of contract data, this paper explores the most prominent trends of what, how, and from whom DoD has been buying. These trends provide vital information describing the status of defense acquisition as it sets out to undergo perhaps “the most transformational acquisition policy change we’ve seen in decades.”1 These policy changes include, notably, a markedly increased emphasis on the use of authorities such as the Middle Tier of Acquisition and Other Transaction Authority agreements. Additionally, exploring FY 2019 contracting trends will provide a better understanding of how the acquisition system is responding to the priorities outlined in the 2018 National Defense Strategy. While the FY 2018 trends provided some preliminary insights, FY 2019 will be the first full fiscal year planned and executed under the 2018 National Defense Strategy.
This report uses the methodology used in CSIS reports on federal contracting. For over a decade, the Defense-Industrial Initiatives Group (DIIG) has issued a series of analytical reports on federal contract spending for national security by the government. These reports are built on Federal Procurement Data System (FPDS) data, which is downloaded in bulk from USAspending.gov. DIIG now maintains its own database of federal spending, which includes data from 1990–2019. This database is a composite of FPDS and DD350 data. For this report, the study team relied on FY 2000–FY 2019 data. All dollar figures are in constant FY 2019 dollars, using the latest Office of Management and Budget (OMB) deflators. For additional information about the CSIS contracting data analysis methodology, see https://github.com/CSISdefense/Lookup-Tables.
For this paper, CSIS focused on the following research questions:
- Area: Has there been a significant shift in DoD investment between and within the areas of products, services, and research and development (R&D) to reflect the 2018 National Defense Strategy priorities?
- Platform Portfolio: Have there been significant changes across the different sectors of the defense industrial base?
- R&D: Has DoD started to recover from its trough in the development pipeline for major weapon systems?
- Other Transaction Authorities: What are the significant trends in OTA usage across DoD and how does the growth of OTAs affect DoD’s technology development efforts?
- Components: Have there been significant shifts in defense contracting trends between the major DoD components?
DoD Contract Spending in a Budgetary Context
Defense contract spending continued to grow in FY 2019, but at a lower rate than before, as overall defense spending has started to level off. As shown in Figure 1, total defense contract obligations increased from $365.4 billion in FY 2018 to $381.2 billion in FY 2019, a 4 percent increase. In FY 2019, contract obligations accounted for 55 percent of DoD TOA, the third-highest level of the last 20 years. Defense contract obligations have grown 31 percent since FY 2015, which was the last year of the previous defense drawdown. As budget levels appear set to remain flat with respect to inflation in the coming years, it is likely to be very challenging for contract obligations to maintain this large share of TOA.
Figure 1: Defense Contract Obligations v. Budget Authority, 2000–2019
 As detailed in prior CSIS analysis of contract data, there has not yet been a significant shift in DoD’s investment posture towards the emerging technologies emphasized in the 2018 National Defense Strategy.2 However, FY 2019 defense contract data does show some emergent shifts in the composition of DoD’s investment portfolio. Defense Products, which had seen the largest gains during the beginning of the defense contracting rebound, has started to slow down—increasing just 3 percent last year, a rate in-line with the total growth of the defense contracting rebound. Defense Services continued its growth path from last year, increasing 13 percent in FY 2019, a rate significantly above the total growth in defense contracting. Finally, Defense R&D contract obligations increased 13 percent in FY 2019. Overall, if you include both R&D Contract and OTA Obligations, defense R&D spending increased 22 percent in FY 2019. This is consistent with the observation in CSIS’s FY 2018 analysis, which showed that technology development has been shifting decisively towards OTAs and away from traditional acquisition approaches. As detailed in prior CSIS analysis of contract data, there has not yet been a significant shift in DoD’s investment posture towards the emerging technologies emphasized in the 2018 National Defense Strategy.2 However, FY 2019 defense contract data does show some emergent shifts in the composition of DoD’s investment portfolio. Defense Products, which had seen the largest gains during the beginning of the defense contracting rebound, has started to slow down—increasing just 3 percent last year, a rate in-line with the total growth of the defense contracting rebound. Defense Services continued its growth path from last year, increasing 13 percent in FY 2019, a rate significantly above the total growth in defense contracting. Finally, Defense R&D contract obligations increased 13 percent in FY 2019. Overall, if you include both R&D Contract and OTA Obligations, defense R&D spending increased 22 percent in FY 2019. This is consistent with the observation in CSIS’s FY 2018 analysis, which showed that technology development has been shifting decisively towards OTAs and away from traditional acquisition approaches.
If you include both R&D Contract and OTA Obligations, defense R&D spending increased 22 percent in FY 2019.
Figure 2 shows defense contract obligations by area from FY 2000 to FY 2019.
Figure 2: Defense Contract Obligations by Area, 2000–2019
 Defense Contract Obligations by Platform Portfolio Defense Contract Obligations by Platform Portfolio
The data show mixed trends for the platform portfolios emphasized in the NDS: Air and Missile Defense; Nuclear; Space; Cyberspace; and C4ISR.3
Air and Missile Defense contract obligations continued to whipsaw over the course of the defense contracting rebound, declining 18 percent in FY 2019 despite their emphasis in the 2018 National Defense Strategy. Air and Missile Defense contract obligations fell from $13.7 billion in FY 2018 to $11.3 billion. Despite this recent decline, Air and Missile Defense contract obligations increased 13 percent overall between FY 2015 and FY 2019.
Space Systems, the rate for which had been previously flat or slightly declining over the defense contracting rebound, saw substantial growth in defense contract obligations in FY 2019. Space Systems contract obligations increased from $6.1 billion in FY 2018 to $7.3 billion in FY 2019, a 20 percent increase. In spite of this, contract obligations remain lower than the levels seen before sequestration and the defense drawdown.
Electronics, Communications, and Sensors (EC&S) once again increased in FY 2019, continuing their constant steady growth throughout the defense contracting rebound. EC&S contract obligations increased 5 percent in FY 2019, a rate in line with the topline growth, going from $52.0 billion in FY 2018 to $54.7 billion in FY 2019. Between FY 2015 and FY 2019, EC&S contract obligations have increased 30 percent.
Ordnance and Missiles contract obligations increased 15 percent in FY 2019, a rate substantially higher than the overall defense contracting growth rate. In FY 2019, Ordnance and Missiles contracts totaled $26.5 billion, the highest levels seen in the last twenty years. Between FY 2015 and FY 2019, Ordnance and Missiles contract obligations increased 79 percent, the largest percentage growth amongst all platform portfolios.
Aircraft contract obligations increased 6 percent in FY 2019, continuing the sector’s whipsaw between growth and decline, an ongoing phenomenon since sequestration and the defense drawdown.4 Over the last four years, Aircraft Defense contract obligations rose from $65.7 billion in FY 2015 to $79.9 billion in FY 2016, then further rose to $89.9 billion in FY 2017, before falling to 84.8 billion in FY 2018 and then rising to $90.0 billion in FY 2019. In total over the course of the defense contracting rebound, Aircraft Defense contract obligations have increased 37 percent since FY 2015, a rate higher than topline growth (31 percent).
Figure 3 shows defense contract obligations by platform portfolio from FY 2000 to FY 2019.
Figure 3: Defense Contract Obligations by Platform Portfolio, 2000–2019
 Defense Contract Obligations by Stage of R&D Defense Contract Obligations by Stage of R&D
Previous CSIS research for FY 2018 shows that “DoD has made some recovery in its development pipeline for major weapon systems, but recovery has been uneven across the different R&D activities.”5 The FY 2019 data show that R&D contracting for the early and mid-stages of the development pipeline for major weapon systems have recovered, but that this is not the case for later stages.
Defense Basic Research (6.1) contract obligations increased from $3.77 billion in FY 2018 to $3.95 billion in FY 2019, a 5 percent increase. Defense Applied Research (6.2) contract obligations increased 11 percent in FY 2019, rising from $7.02 billion to $7.78 billion. Defense Basic Research and Applied Research contract obligations both increased 18 percent between FY 2015 and FY 2019.
Both of the mid-stage R&D activities, Advanced Technology Development (6.3) and Advanced Component Development and Prototypes (6.4), continued to grow at rates greater than the overall growth in defense R&D contract obligations. Advanced Technology Development (6.3) contract obligations increased from $4.80 billion in FY 2018 to $6.05 billion in FY 2019, a 26 percent increase. Advanced Component Development and Prototypes contract obligations increased 21 percent in FY 2019, rising from $6.03 billion to $7.27 billion. Between FY 2015 and FY 2019, Advanced Technology Development and Advanced Component Development and Prototypes contract obligations increased 44 percent and 73 percent respectively.
System Development and Demonstration (6.5) and Operational Systems Development (6.7) remained relatively flat in FY 2019. System Development and Demonstration contract obligations totaled approximately $4.1 billion in FY 2018 and FY 2019, while those for Operational Systems Development totaled approximately $0.7 billion in the past two years. Between FY 2015 and FY 2019, System Development and Demonstration and Operational Systems Development contract obligations have declined 10 percent and 34 percent respectively.
Figure 4 shows defense contract obligations by stage of R&D from FY 2000 to FY 2019.
Figure 4: Defense R&D Contract Obligations, 2000–2019
 OTA Usage across DoD OTA Usage across DoD
OTA usage across DoD continues to grow in response to the FY 2016 legislative changes to the National Defense Authorization Act (NDAA), aimed at incentivizing their usage. DoD OTA obligations rose from $4.4 billion in FY 2018 to $7.7 billion in FY 2019, a 75 percent increase. Between FY 2015 and FY 2019, DoD OTA obligations increased 712 percent, rising from just $0.95 billion to $7.7 billion.
Figure 5 shows defense OTA obligations from FY 2015 to FY 2019.
Figure 5: Defense OTA Obligations, 2015–2019
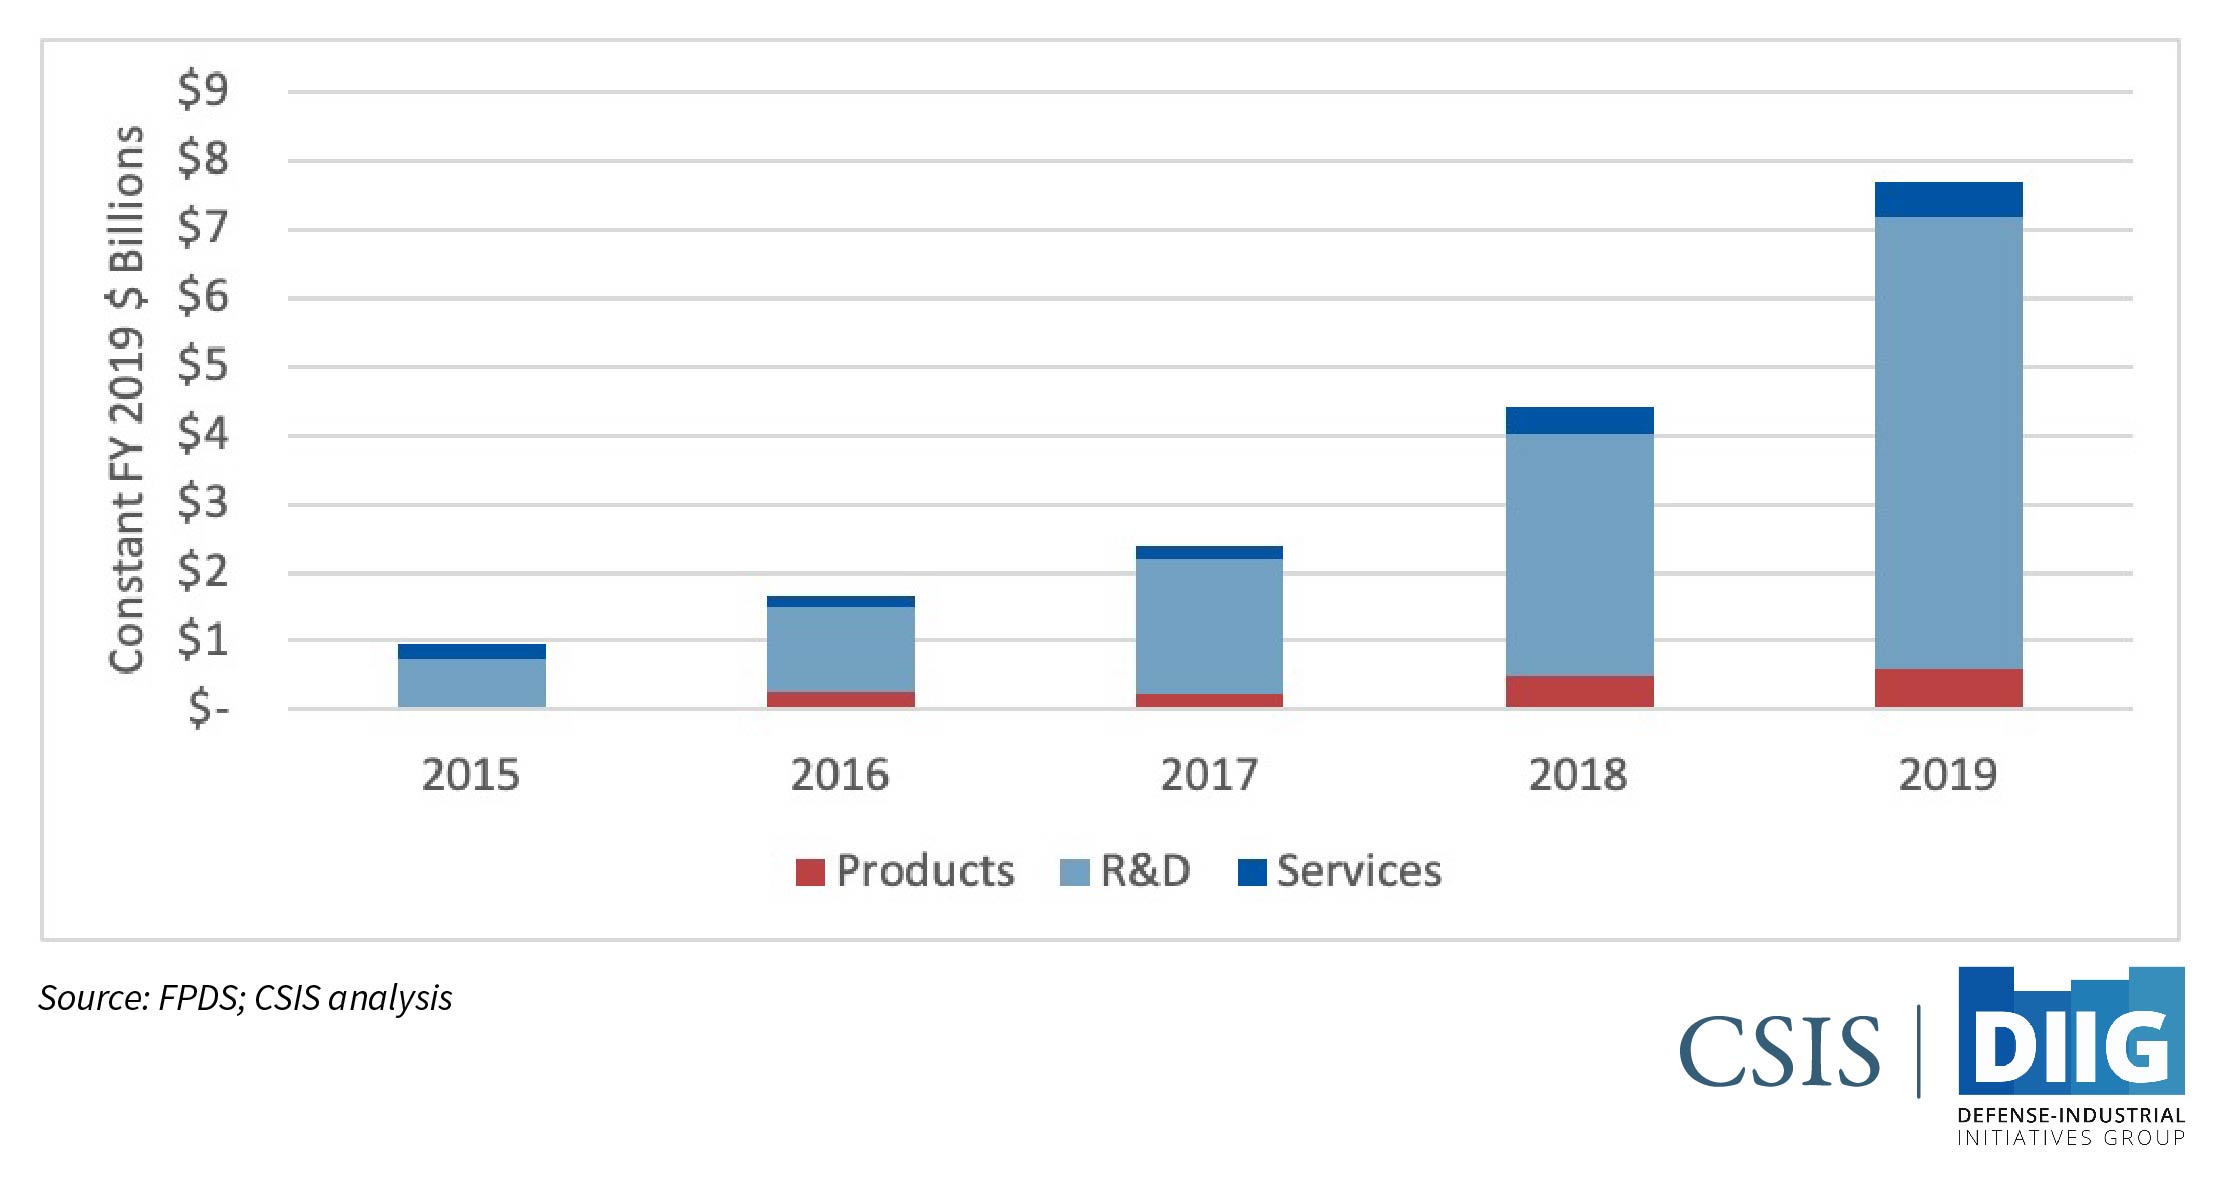
 While OTAs are predominantly used for R&D, they are not exclusively limited to those activities. The data show that, on average, 82 percent of OTA obligations over the last five years have gone towards R&D, while products and services each account for 9 percent of total DoD OTA obligations. Furthermore, the data show that while the recent growth in OTA obligations has been predominantly for R&D, both products and services have also seen significant growth in recent years. Since FY 2016, defense products OTA obligations have increased 124 percent while defense services OTA obligations have increased 280 percent—compared to a 426 percent growth in defense R&D OTA obligations. While OTAs are predominantly used for R&D, they are not exclusively limited to those activities. The data show that, on average, 82 percent of OTA obligations over the last five years have gone towards R&D, while products and services each account for 9 percent of total DoD OTA obligations. Furthermore, the data show that while the recent growth in OTA obligations has been predominantly for R&D, both products and services have also seen significant growth in recent years. Since FY 2016, defense products OTA obligations have increased 124 percent while defense services OTA obligations have increased 280 percent—compared to a 426 percent growth in defense R&D OTA obligations.
Figure 6 shows defense OTA obligations by area from FY 2015 to FY 2019.
Figure 6: Defense OTA Obligations by Area, 2015–2019
 The Army remains the leader in OTA usage across DoD components, but the other components saw significant upticks in OTA usage. In FY 2019, Army OTA obligations increased from $3.07 billion to $4.95 billion, a 61 percent increase. Over the last four years, Army OTA obligations have increased 416 percent since FY 2016. The Air Force increased OTA obligations by 190 percent in FY 2019, going from $0.54 billion in FY 2018 to $1.56 billion in FY 2019. Between FY 2016 and FY 2019, Air Force OTA obligations increased 486 percent. The Navy, which had reported marginal OTA obligations in previous years, saw a surge in OTA obligations in FY 2019, but still lags behind the other services. Navy OTA obligations rose from $0.03 billion in FY 2018 to $0.17 billion in FY 2019, a 431 percent increase. The Army remains the leader in OTA usage across DoD components, but the other components saw significant upticks in OTA usage. In FY 2019, Army OTA obligations increased from $3.07 billion to $4.95 billion, a 61 percent increase. Over the last four years, Army OTA obligations have increased 416 percent since FY 2016. The Air Force increased OTA obligations by 190 percent in FY 2019, going from $0.54 billion in FY 2018 to $1.56 billion in FY 2019. Between FY 2016 and FY 2019, Air Force OTA obligations increased 486 percent. The Navy, which had reported marginal OTA obligations in previous years, saw a surge in OTA obligations in FY 2019, but still lags behind the other services. Navy OTA obligations rose from $0.03 billion in FY 2018 to $0.17 billion in FY 2019, a 431 percent increase.
Between FY 2015 and FY 2018, the Army accounted 73.6 percent of total defense OTA obligations; the Air Force and DARPA both accounted for 12 percent, while the Navy accounted for less than 1 percent. In FY 2019, the Army accounted for 67 percent of defense OTA obligations, the Air Force accounted for 21 percent, DARPA fell to 6 percent, and the Navy rose slightly to 2 percent.
The Army remains the leader in OTA usage across DoD components, but the other components saw significant upticks in OTA usage.
Figure 7 shows defense OTA obligations by customer from FY 2015 to FY 2019.
Figure 7: Defense OTA Obligations by Customer, 2014–2019
 Defense Components Defense Components
Navy contract obligations, which had been on the decline, rebounded in FY 2019. Navy contract obligations increased from $109.9 billion in FY 2018 to $120.1 billion, a 9 percent increase. As a share of total defense contract obligations, the Navy rose from 30 percent to 32 percent. Between FY 2015 and FY 2019, Navy contract obligations increased 33 percent.
The Air Force experienced a year-to-year whipsaw at the start of the defense contracting rebound, but has seen steady growth each of the past two years.6 Air Force contract obligations increased from $73.0 billion in FY 2018 to $75.7 billion in FY 2019, a 4 percent increase. As a share of total defense contract obligations, the Air Force remained steady at 20 percent. Between FY 2015 and FY 2019, Air Force contract obligations increased 34 percent.
After seeing a large upswing in FY 2018, the Army returned to slow but steady growth last year. Army contract obligations increased from $93.4 billion in FY 2018 to $94.8 billion in FY 2019, a 1 percent increase. As a share of total defense contract obligations, the Army fell slightly, from 26 percent to 25 percent. Between FY 2015 and FY 2019, Army contract obligations have increased 23 percent, the lowest amongst the three military services and below the overall growth in defense contract obligations (31 percent).
In FY 2018, Defense Logistics Agency (DLA) and Missile Defense Agency (MDA) contract obligations reached near-historic levels, growing at rates significantly above the defense topline and increasing by 26 percent and 51 percent respectively. FY 2019, however, tells a very different story for these two components: MDA contract obligations increased by only 4 percent in FY 2019, rising from $8.45 billion to $8.81 billion—still the highest level seen in the last twenty years—while DLA contract obligations declined by 4 percent. Between FY 2015 and FY 2019, MDA contract obligations increased 76 percent.
Figure 8 shows defense contract obligations by component from FY 2000 to FY 2019.
Figure 8: Defense Contract Obligations by Component, 2000-2019
 Conclusion Conclusion
Defense contract obligations continued to grow even as defense budget leveled off
After substantial growth at the start of the defense contracting rebound, defense contract spending continued to rise in FY 2019, but at a lower rate than before, as total defense spending has started to level off. In FY 2019, defense contract obligations accounted for 55 percent of DOD total obligation authority (TOA), the third-highest level over the last 20 years. As budgets levels appear set to remain flat with respect to inflation in the coming years, it is likely to be very challenging for contract obligations to maintain this large share of TOA.
Mixed trends in the 2018 National Defense Strategy priority platform portfolios
The data show mixed trends for the platform portfolios emphasized in the NDS (Air and Missile Defense, Nuclear, Space, Cyberspace, and C4ISR).
Electronics, Comms, and Sensors continued its steady growth over the course of the defense contracting rebound, increasing 5 percent in FY 2019. In total, EC&S contract obligations are up 30 percent over the course of the defense contracting rebound.
Space Systems, which had been generally flat over the course of the defense contracting rebound, saw a 20 percent increase in contract obligations in FY 2019.
Air and Missile Defense contract obligations continued to whipsaw over the course of the defense contracting rebound, declining 18 percent in FY 2019.
Substantial growth in mid-stage of the weapon systems pipeline
The data show that there has been a recovery in most of the development pipeline for major weapon systems—particularly in the middle stages—but not in the later stages. Contract obligations for the early R&D stages, Basic Research (6.1) and Applied Research (6.2), both increased in FY 2019, albeit at a slower rate of growth than the total growth in defense contracting. However, growth was more substantial in the mid-stage of the weapon systems development pipeline: in FY 2019, Advanced Technology Development (6.3) and Advanced Component Development and Prototypes (6.4) contract obligations increased 26 percent and 21 percent respectively. Comparatively, contract obligations for the later states of the development pipeline, System Development and Demonstration (6.5) and Operational Systems Development (6.7), were essentially flat.
OTA usage continues increasing across DoD
OTA usage across DoD continues to surge in response to the FY 2016 NDAA legislative changes that aimed to incentivize their usage. In FY 2019, defense OTA obligations increased from $4.4 billion to $7.7 billion, a 75 percent increase. Over the last four years, defense OTA obligations have increased 366 percent.
The Army remains the predominant user of OTAs across all of DoD, but other components, notably the Air Force, have significantly increased their usage of OTAs. Army OTA obligations increased 61 percent in FY 2016 and are up 416 percent since FY 2016. Air Force OTA obligations increased from $0.54 billion in FY 2018 to $1.56 billion in FY 2019, a 190 percent increase.
The magnitude of growth here is enormous; it is no longer a question of whether OTAs are supplanting traditional defense acquisition, but whether this transition is permanent.
Navy and Air Force bounce back; Army slows down, but continues growing
Navy contract obligations, which had been on the decline, rebounded in FY 2019, increasing 9 percent. As a share of total defense contract obligations, the Navy rose from 30 percent to 32 percent.
After experiencing a year-to-year whipsaw at the start of the defense contracting rebound at the start of the defense contracting rebound, the Air Force has seen steady growth the past two years. Air Force contract obligations increased from $73.0 billion in FY 2018 to $75.7 billion in FY 2019, a 4 percent increase.
The Army returned to slow but steady growth in FY 2019, after having seen a large increase in FY 2018. Army contract obligations increased from $93.4 billion in FY 2018 to $94.8 billion in FY 2019, a 1 percent increase. Between FY 2015 and FY 2019, Army contract obligations have increased 23 percent—the lowest rate of growth amongst the three military services, and below the overall growth in defense contract obligations (31 percent).
Final Thoughts
Defense contract spending continued to grow in FY 2019, but at a lower rate than before, as overall defense spending has started to level off
Given the significant evidence of the transformation of the acquisition system demonstrated in the FY 2019 contract data, it is worthwhile to think about the longer-term implications of DoD’s new approach to technology development. One major question is whether the prototyping efforts occurring under OTAs—which now represent the overwhelming majority of DoD’s investment in new product development—will be able to transition directly to production and fielding, or whether an engineering and manufacturing development (EMD) phase will be required to mature prototypes into fieldable systems. An EMD phase might be required to incorporate additional features into the prototype design required for real world operations. Typically, prototyping programs have a reduced emphasis on issues such as sustainability in the field, since the prototype isn’t intended to function as an operational system; an EMD phase would allow for the incorporation of sustainability features and other operational needs, as well as producibility, in a production design. However, since the intent of using rapid prototyping as a primary product development approach has in many cases been to increase the speed of fielding new systems, it is not clear that program officials will want to take the added time required for an EMD phase. The end result could be higher production costs and increased burdens on the sustainment system to support newly fielded systems.
Another major question is whether the non-traditional suppliers who are receiving the bulk of the OTA work will have the institutional and organizational capacity to support the transition from prototype designs into production of operational systems. Typically, DoD will cover the cost of building and tooling production facilities for new systems, but it is still incumbent on the contractor to be able to manage sometimes large and complex production centers. For simpler, cheaper prototypes, such facilities may be well within the capabilities of non-traditional suppliers; however, for more complex and expensive systems, this could present a significant management challenge. At the same time, traditional defense technology developers may feel compelled to acquire or partner with emerging non-traditional suppliers, given non-traditional firms’ current dominance in the prototyping marketplace. If traditional defense companies are unable to increase their market share in the next generational of defense systems, their revenue base will start to erode as these systems are fielded. This raises the potential for a substantial round of industry consolidation in the next five to ten years. How might the DOD seek to manage industry consolidation in these circumstances to ensure the continued viability and resilience of the industrial base?
The transformation of the acquisition system currently taking place will likely also lead to other changes that are currently hard to foresee. However, these changes—both those that may be foreseeable and those that aren’t—will manifest in due time in future contract trends.
Rhys McCormick is a fellow with the Defense-Industrial Initiatives Group.
This brief is made possible by general support to CSIS. No direct sponsorship contributed to this brief.
CSIS Briefs are produced by the Center for Strategic and International Studies (CSIS), a private, tax-exempt institution focusing on international public policy issues. Its research is nonpartisan and nonproprietary. CSIS does not take specific policy positions. Accordingly, all views, positions, and conclusions expressed in this publication should be understood to be solely those of the author(s).
© 2020 by the Center for Strategic and International Studies. All rights reserved.
Please consult the PDF for references. |


修改评论