Global S&T Development Trend Analysis Platform of Resources and Environment
| ABARES Insights: Stocktake of Free trade, competitiveness and a global world: How trade agreements are shaping agriculture | |
| admin | |
| 2020-09-11 | |
| 出版年 | 2020 |
| 国家 | 澳大利亚 |
| 领域 | 资源环境 |
| 英文摘要 | Authors: Andrew Duver and Shujia (Charlie) Qin Aerial view of Outback Cattle mustering featuring herd of livestock cows and bulls in drought and dusty area. Ready for auction and cattle yards.
Source: Shutterstock.com Trade agreements play a major role in enabling competitiveness and sustainability of agricultural industries. Australia has successfully negotiated trade agreements with the majority of its major trading partners. However, other major agricultural exporters have also pursued their own arrangements, sometimes securing similar or even better outcomes. Capturing ongoing benefits to liberalised trade will require that Australia’s negotiations continue to focus on traditional barriers, such as tariffs and tariff‑rate quotas, along with broader technical market access and multilateral engagement. [expand all]An open trade environment has been a feature of Australian agricultureAustralian agriculture has a long history of reliance on world markets. From the early years of exporting wool and grains to Europe, the variety of goods Australia now produces and the number of markets to which it exports have expanded significantly (Pollard 2008). The growth in agricultural production was driven by the adoption of new technologies and an expansion of cultivated area (Hatfield-Dodds, Jackson & Zammit 2020). Australia is now among the top 15 agricultural exporters in the world (WTO 2020a), with the sector exporting about 70% of production to 192 countries (ABS 2020). This success on the world stage could not have been achieved without government and industry partnerships to secure market access in global markets. That access was also assisted over time through negotiated outcomes in multilateral forums, such as the World Trade Organization (WTO), preferential trade agreements (which can be bilateral or plurilateral), and through agreed biosecurity protocols. This article explores the history of Australia's free trade agreements (FTAs) and how they have assisted our export competitiveness and the growth of agricultural exports. It also looks more broadly at the global proliferation of FTAs, to examine how the benefits of tariff reductions achieved through FTAs can be eroded by competitors in shared markets. Australia's FTAs have broadened our marketsBetween 1980 and 2000 the Australian Government's trade policies principally focussed its international trade engagement at the multilateral level at the WTO and its predecessor, facilitated through its coalition with like-minded countries as part of the Cairns Group. However, multilateral trade negotiations have since stalled, with the Doha Round of trade negotiations collapsing. While progress slowed at the WTO, Australia began to actively pursue preferential trade agreements, most notably with Asia and the United States, which improved our agricultural market access. Among the benefits of having numerous trade agreements is the reduction in Australia's exposure to disruptions in other markets. The reductions in import tariffs and other trade barriers, and improvements to tariff-rate quotas (TRQs), are also obvious benefits. Lower tariffs improve the competitiveness of Australian products in our export markets and reduce the price of imported agricultural products paid by Australian consumers. Some FTAs also provide guaranteed access for some commodities to the importing country through preferential TRQs. The agreements themselves can be between two countries (bilateral) or between several countries (plurilateral). In plurilateral agreements, negotiated improvements to market access provisions are applied across numerous markets but, as a consequence, often take longer to finalise. In the 10 years to 2020, Australia signed 9 FTAs, including the most recent Indonesia-Australia Comprehensive Economic Partnership Agreement (IA-CEPA) (Figure 1). As at July 2020 Australia had 14 FTAs in force, 1 FTA negotiated but not in force, and 4 FTAs under negotiation (DFAT 2020a). In 2019–20, 81% of Australian agricultural exports were destined for countries with which Australia had a preferential trade agreement. 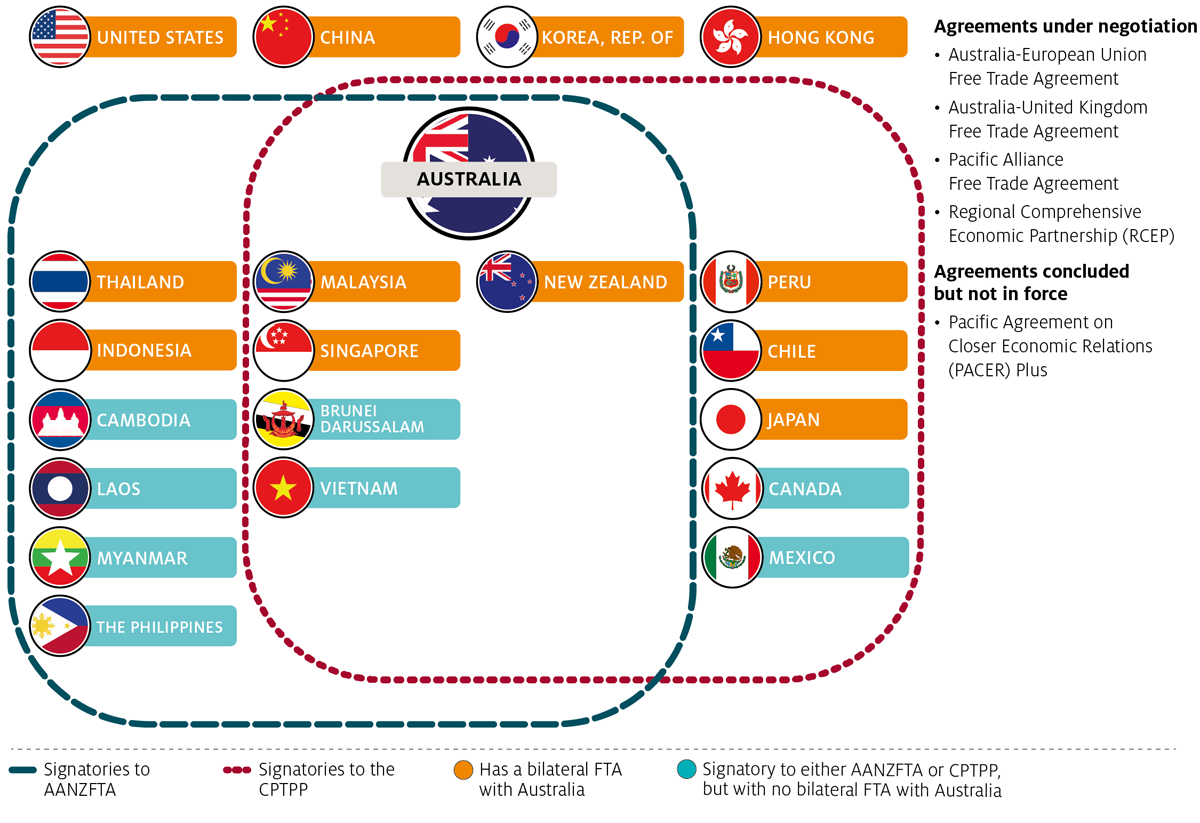
Source: Adapted from DFAT 2019 and 2020d. A consequence of the proliferation of Australia's trade agreements is that distinct and separate arrangements can apply to the same countries. The Comprehensive and Progressive Agreement for Trans-Pacific Partnership (CPTPP) and ASEAN-Australia-New Zealand Free Trade Area (AANZFTA) are plurilateral agreements covering multiple parties, including some with which Australia also has a bilateral agreement (Figure 1). For example, Australia has an FTA with Japan—the Japan-Australia Economic Partnership Agreement (JAEPA)—but both countries are also parties to the CPTPP, a plurilateral agreement with 9 other signatories. In 2019 Australia and Japan also agreed to sign the 15-country Regional Comprehensive Economic Partnership (RCEP) (DFAT 2020b). Multiple agreements with the same country bring about greater trade liberalisation and can improve market access. For example, 85% of Australia's agricultural exports to Indonesia were covered by AANZFTA, while the 2020 IA‑CEPA agreement secured preferential access for 99% (DFAT 2020c). IA-CEPA improved market access outcomes to Indonesia compared to AANZFTA by providing some additional tariff reductions. Under IA‑CEPA Indonesia also agreed to issue import permits automatically and on an annual basis without seasonality for some agricultural products. A downside to multiple agreements with a single partner is that they increase the complexity of the trading landscape for exporters, who need to understand and navigate the terms of multiple agreements for trade to that country. The complexity of recent trade agreements is apparent in the wider scope of technical market access requirements beyond tariffs, such as rules of origin, sanitary and phytosanitary measures (SPS) and technical barriers to trade (TBT) (Thompson‑Lipponen & Greenville 2019). These requirements can increase exporters' costs, especially when there are variances between the technical rules that might be explicit in one agreement but not in another. Asia has become our main export destinationIn the 20 years to 2019–20 Australia's agricultural exports grew by 20% to $48.4 billion (in 2019–20 dollars, Figure 2). That growth can be directly attributed to our trade within the Asian region, and indirectly with Australia's FTAs with several Asian countries, including ASEAN, China, Japan and the Republic of Korea. Australia's share of total agricultural exports to Asia increased from 52% in 1999–00 to 76% in 2019–20. 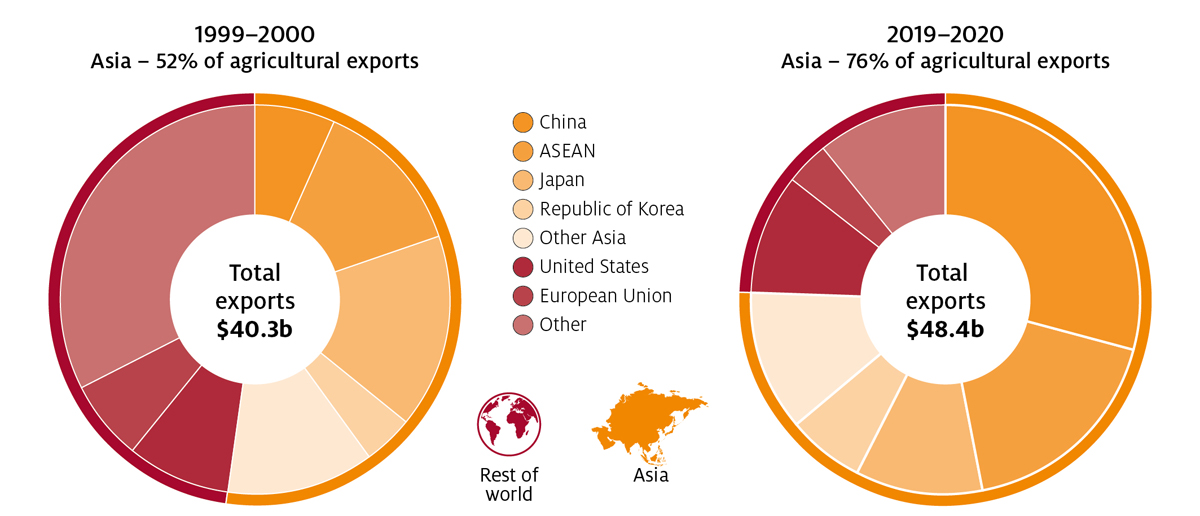
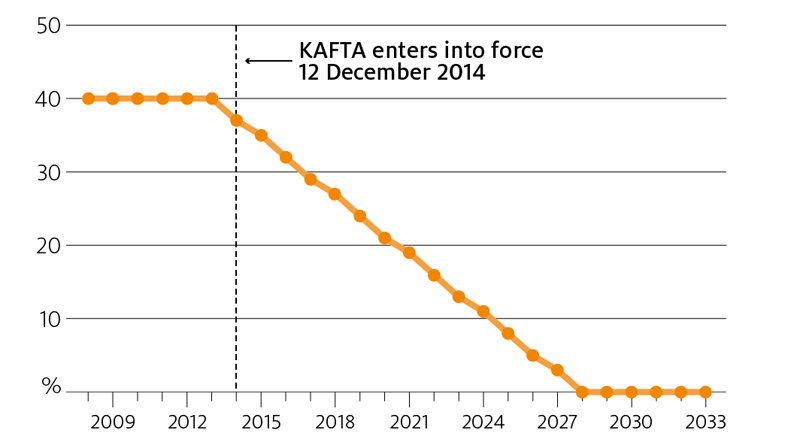
Source: ABS 2020 China and ASEAN are 2 markets that have become more important for Australian agricultural exporters since 2000. Between 1999–00 and 2019–20 Australia's share of agricultural exports to China increased from 7% to 29%, and to ASEAN it increased from 13% to 18%. China and ASEAN are now Australia's first and second largest agricultural export markets, respectively. Their long-term population and income growth trends, and higher urbanisation rates, have not only resulted in an increase in the demand for food overall but also a change in the types of food demanded, many of which are now imported. Per person consumption patterns have transformed from traditional diets with a strong reliance on staple grains (mainly rice) and relatively low intake of protein, to more varied, Western-style diets with greater consumption of dairy, fruit, meat, seafood, wheat-based products and vegetables (Eather, Hamshere & Moir 2013). Japan and Korea remain important markets for Australian agricultural products despite relatively stable demand for imported agricultural products compared to China and ASEAN. Competition in both markets has also increased over the past decade, with both countries parties to preferential agreements with the European Union and the United States. The Korea–Australia Free Trade Agreement (KAFTA 2014) and JAEPA (2015) support the competitiveness of our agricultural products in those markets, and for some commodities provide a price advantage relative to our competitors. While agricultural export growth has slowed over the past 10 years, both Japan and Korea remain among Australia's top export destinations and are important in terms of market diversification. Trade agreements promote efficient market operationsTrade barriers distort trade by increasing the price of foreign goods in the importing market. The higher price discourages consumers from purchasing the foreign good in favour of a domestically-produced good. In response, the domestic industry produces more of that commodity than it otherwise might if the trade barrier did not exist. Consumers pay more for it and have less choice in what they can purchase. Removing trade barriers improves market efficiencies. Lower trade barriers benefit consumers by lowering the price of imported commodities and improving consumers' choices. They also lead to fewer distortions in the market because more efficient producers are able to compete in the global market. Finally, lowering trade barriers across global value chains lowers costs for producers and consumers at different stages along the supply chain. This improves competitiveness across the different industries that form part of that chain. For example, lowering tariffs on imported inputs, such as chemicals and fertilisers, can lower production costs for primary agricultural producers. For more processed foods, like Indonesian noodles that use imported Australian wheat as an input, lower tariffs on wheat improve production efficiencies and competitiveness across manufacturers. Trade barriers are removed gradually to facilitate adjustmentFor highly protected markets, that is, those with high tariffs and other forms of government support, the fast removal of tariffs can cause a significant diversion by consumers away from the domestically-produced products to imported products. A swift drop in demand can cripple inefficient domestic industries that rely on government support policies. For that reason, trade concessions negotiated in FTAs are often implemented over time. While less efficient producers may be forced out of the market, it is also the case that increased competition spurs innovation and investment to improve productivity. Tariffs are decreased over an agreed number of stages, starting on the date the agreement enters into force and then annually, either on each subsequent anniversary of the agreement or an alternative agreed date (e.g. start of the calendar year or of a country's fiscal year). The scheduled tariff reductions provide the domestic industry with time to adjust to a gradual increase in competition with imported products. For the exporting country, scheduled tariff reductions delay the realisation of the full benefits of negotiated outcome. Japan and Korea are two examples of historically protectionist countries with high tariffs on many agricultural imports, including dairy, horticulture and livestock. The high tariffs were designed to protect domestic industries from lower-cost exporters like Australia and the United States. However, Japan and Korea both agreed to several significant tariff reductions in JAEPA and KAFTA. For example, under KAFTA, Korea agreed to eliminate tariffs on Australian beef from the most-favoured nation (MFN) rate of 40%. However, conscious of the negative impact a swift removal of the tariff would have on the domestic industry, it agreed to gradually eliminate the tariffs in equal increments over 15 stages. The first cut was on 12 December 2014 and the second and each subsequent cut on 1 January (Figure 3).
Tariffs on beef have often been applied in combination with safeguard measures as part of the negotiated outcomes of FTAs, to ensure the gradual adjustment of the domestic industry to the new trading environment. Safeguard measures specify a permissible quantity of imports from a partner country within a calendar year. If imports from that country exceed the safeguard, a higher tariff can be imposed, often returning to the MFN rate. Under KAFTA the negotiated tariff decrease was accompanied by a safeguard, which could be triggered if imports of Australian beef reached 154,584 tonnes in 2014. This safeguard increases by approximately 2% each year over the 15 year tariff-reduction period. Our competitors also receive preferential access to many export marketsAustralia is not unique in its pursuit of preferential trade agreements. Following the stalling of the Doha Round, there has been a proliferation of trade agreements as countries have sought more quickly realisable trade outcomes (Figure 4). As of 1 July 2020 there were 305 trade agreements in force globally (WTO 2020b). 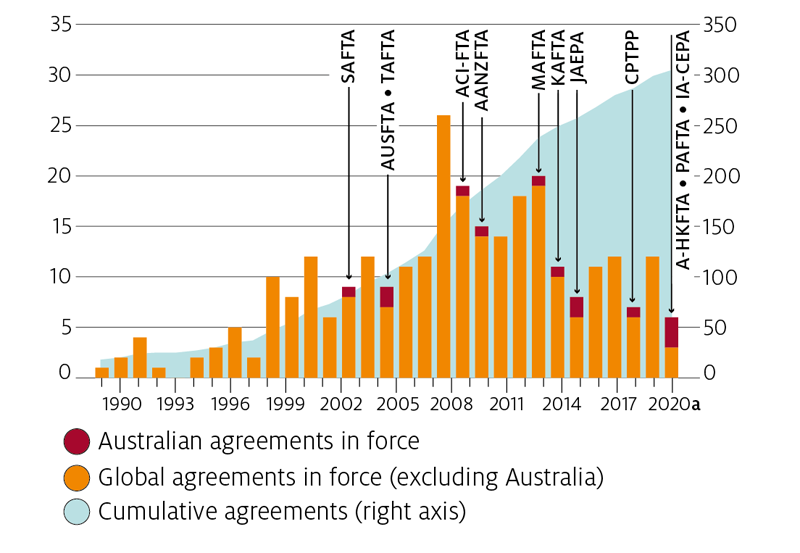
Source: DFAT 2020a; WTO 2020a While trade agreements have improved Australia's access to many markets, our competitors have also benefitted from the same or similar arrangements, sometimes with the same countries and with similar or better tariff outcomes. For example, Australia has FTAs with each of its top 5 export markets—China, Japan, the United States, Korea and ASEAN. These countries also have numerous trade agreements, many of them with our major competitors. For Japan and Korea the majority of their agricultural imports are sourced from their FTA partners (71% for Japan, 84% for Korea) (Figure 5). 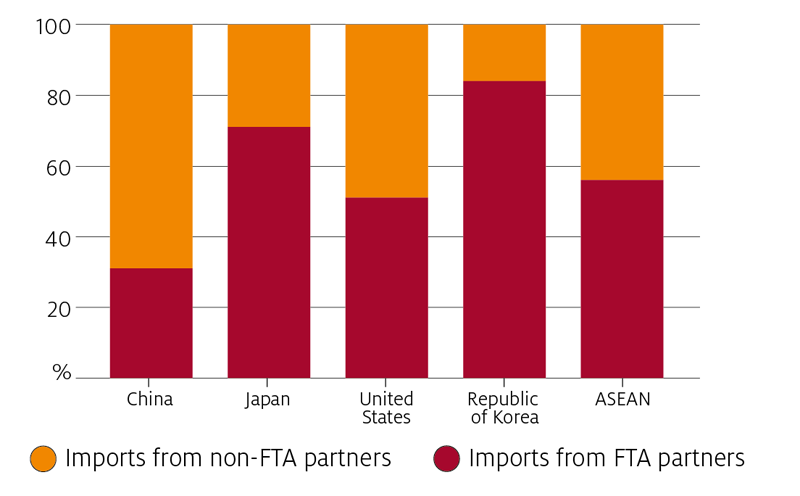
Source: ITC 2020; UN Statistics Division 2020 In addition, the European Union is currently negotiating an FTA with Indonesia. A successful outcome by the European Union could erode some of the benefits achieved by Australia in IA-CEPA and AANZFTA should Indonesia agree to the same market access outcomes for commodities with which we compete with the European Union (DS 2019). Internationally, the shift towards FTAs by many countries has seen more recent trade agreements achieve greater tariff cuts than those negotiated in the past (Thompson‑Lipponen & Greenville 2019). This has likely been driven by new FTA partners seeking equivalent or better terms on agreements than those that were achieved in past agreements. Existing trade agreements therefore require ongoing investment to improve trading conditions as competitors seek equivalent or better terms for their agreements. The proliferation of preferential agreements globally, and their varying complexity, can sometimes result in the most efficient producing countries not benefitting as much as others because they were unable to negotiate as favourable a deal. For this reason, engagement at the multilateral level will continue to be a superior pathway for more equitable trade policy outcomes. It also provides a means to address issues such as agricultural subsidies. The downside to this approach is the length of time it takes to reach an agreement, and hence the long-term commitment required by countries to this process. A truck full of mandarins on a fruit farm in New South Wales, Australia.
Photo: Shutterstock.com The first country to negotiate doesn't always get the best dealEven if two exporting countries have an FTA with a common partner, at any one time those countries may face different trade barriers for the same commodities. For tariffs and TRQs, these differences arise due to the different dates the agreements entered into force and the negotiated tariff reduction schedules. As tariffs are gradually lowered, the country facing the lower tariff is effectively at a competitive advantage, and sometimes that advantage can be significant. However, it is also often the case that the advantage is only temporary, since the final tariff rates at the end of the phased reduction period for a given commodity are often the same across trade agreements with a common partner. For example, in KAFTA and JAEPA, Australia received concessions on beef, as did other beef exporters to those countries (Figure 6). Because other exporters faced the same tariff schedules, in any given year the tariff difference between competitors was relatively small. No competitor had a strong tariff advantage over another. Under JAEPA the concessions received for beef were not as favourable as in the CPTPP, which gave Australia a significant advantage over the United States. This advantage lasted only until 2020, when the United States came to a separate agreement with Japan that, for beef, was equivalent to the CPTPP. Despite the loss or absence of a tariff advantage resulting from a preferential agreement, to remain competitive it is always better to have an agreement in place than to face the higher MFN tariffs. 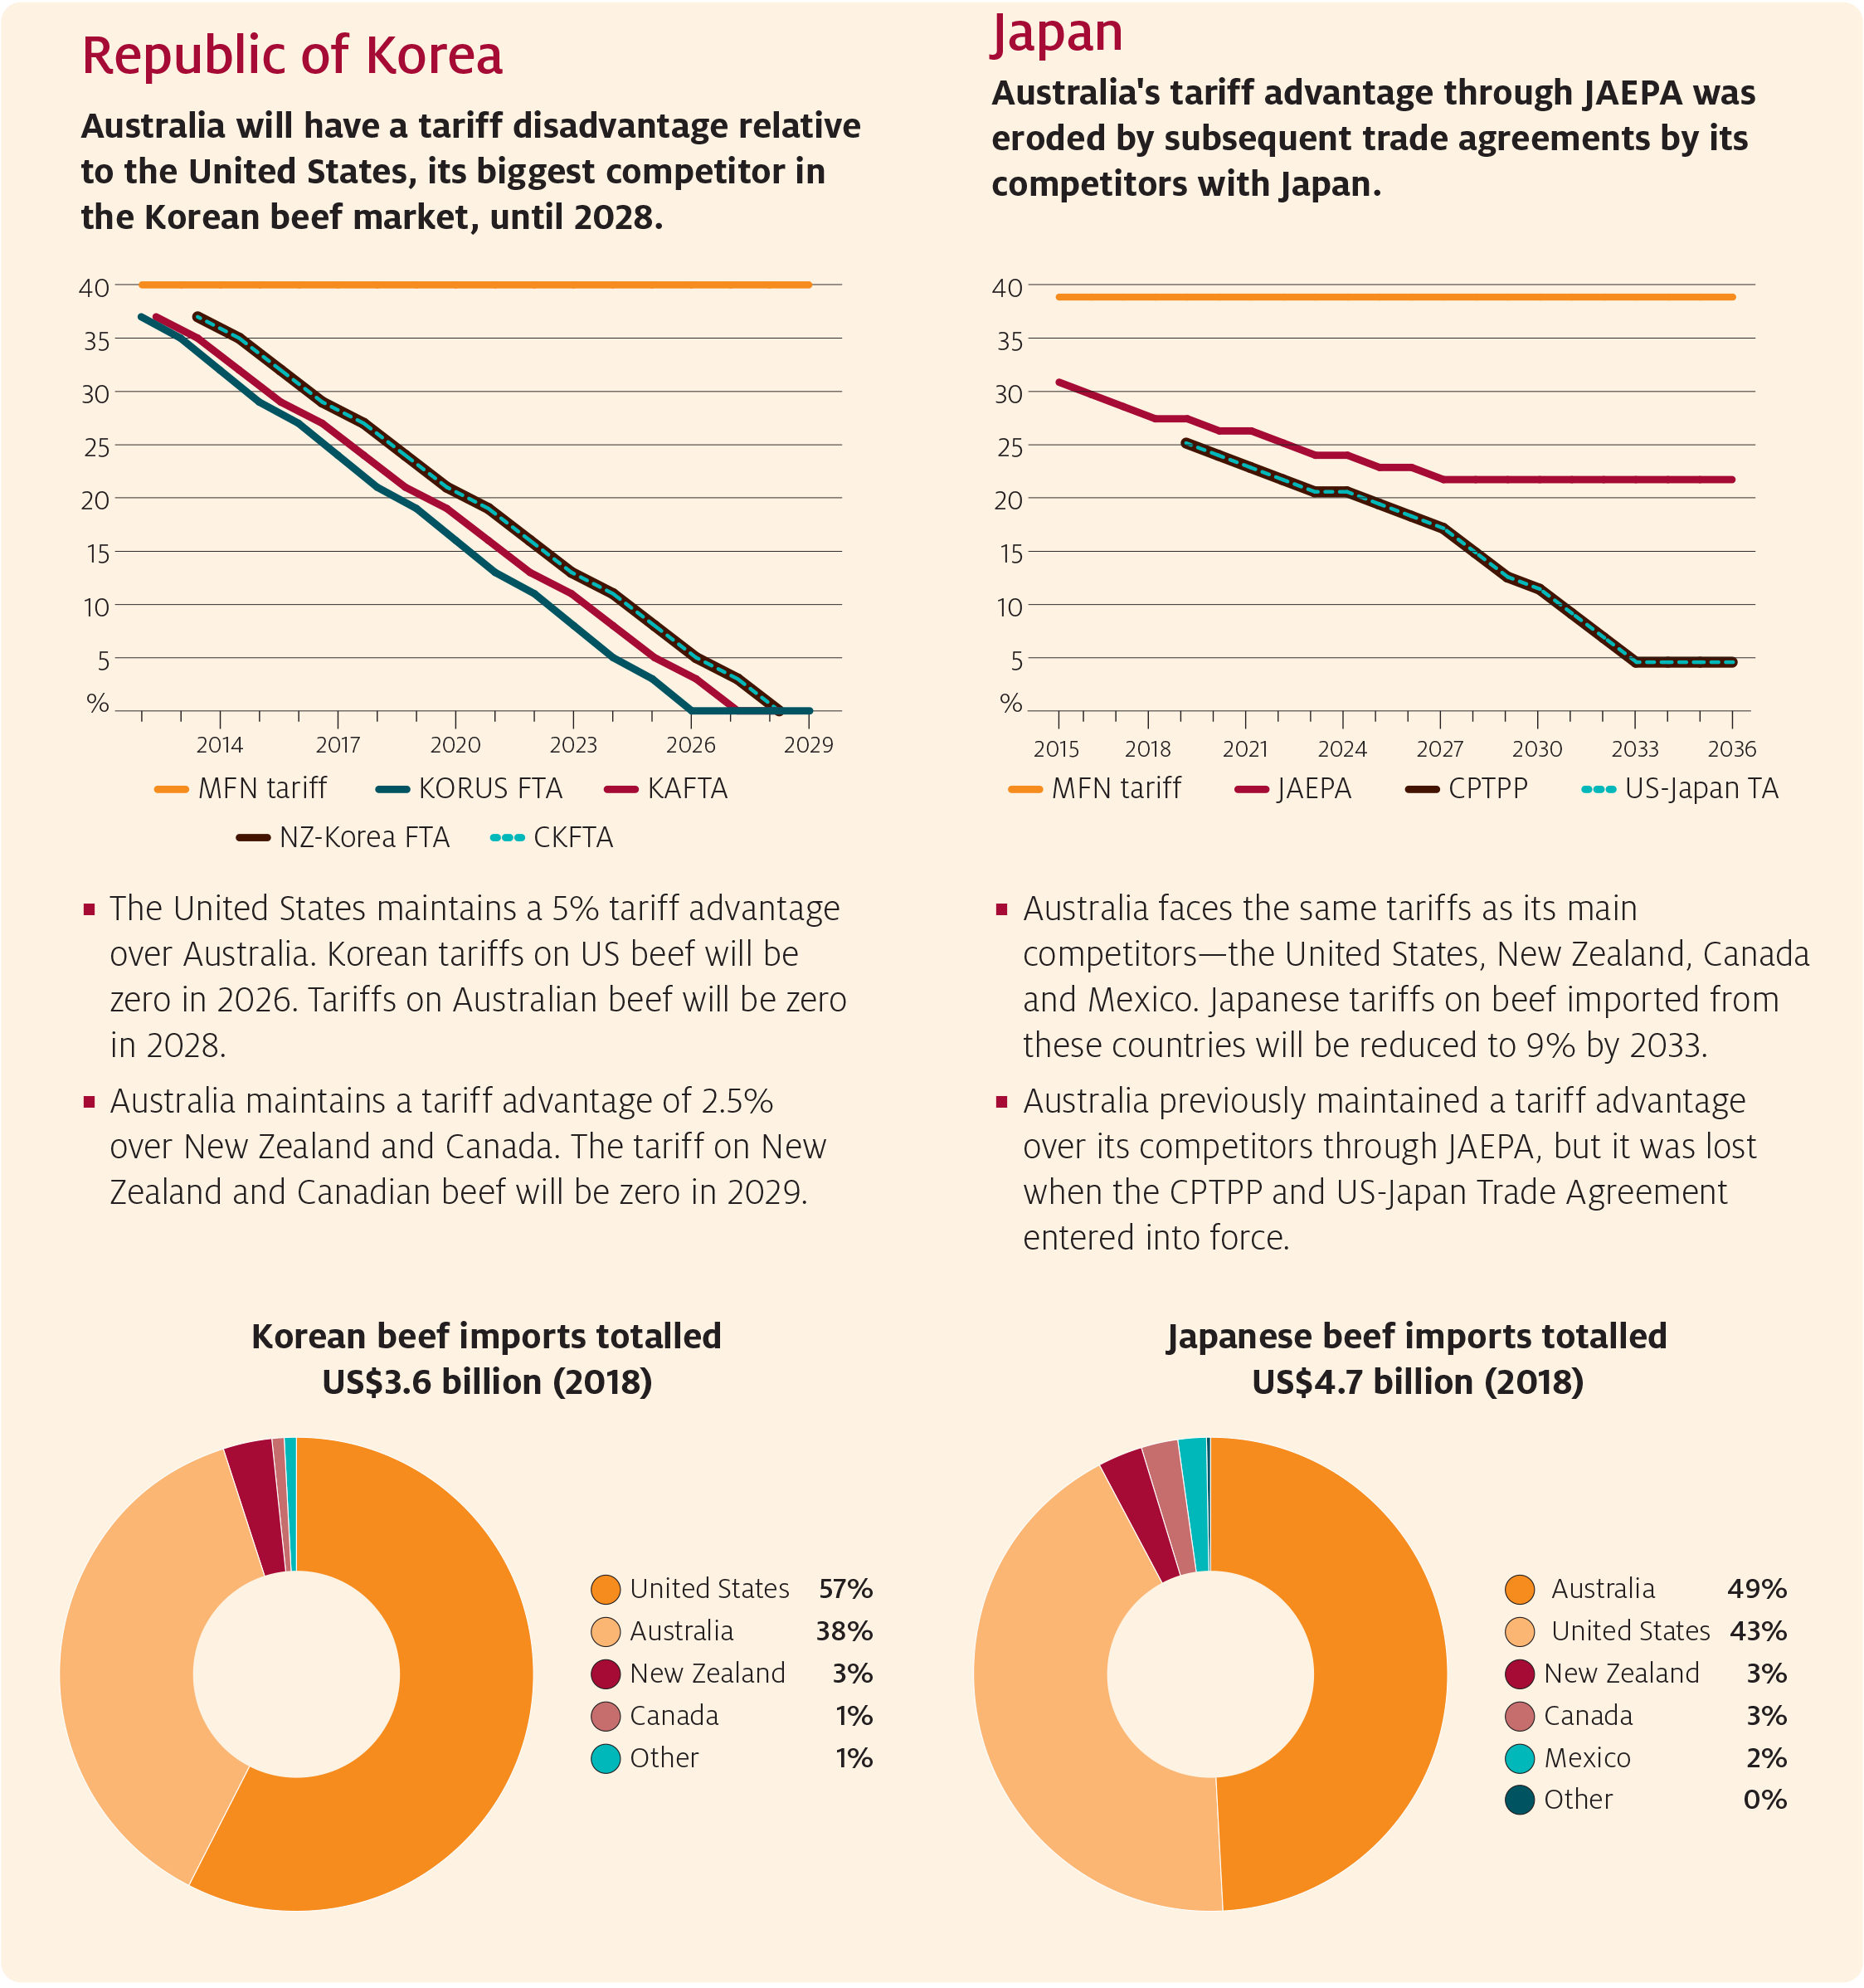
Source DFAT 2020a; GAC 2020; MFAT 2020; UN Statistics division 2020; USTR 2019, 2020 More generally, when both Australia and a competitor have an FTA with a common export market, the overall impact of the agreement on competitiveness will depend on “who got the better deal”. The answer to this question is not only reliant on the agreed tariff reductions but can also be associated with agreed changes to other protective trade measures, such as TRQs and safeguards, and extends to other provisions such as cooperation and standards. As part of an FTA, TRQs may be expanded as tariffs decline, and can be negotiated on a preferential basis rather than on a global basis. This type of arrangement provides a material advantage to the exporter's market access that competitors may not have and is something that future negotiations between FTA partners can build upon. For example, the allocation of different cheese TRQs by Japan and Korea across FTAs with different partners demonstrates the relative competitive advantages of their trade partners (Figure 7). 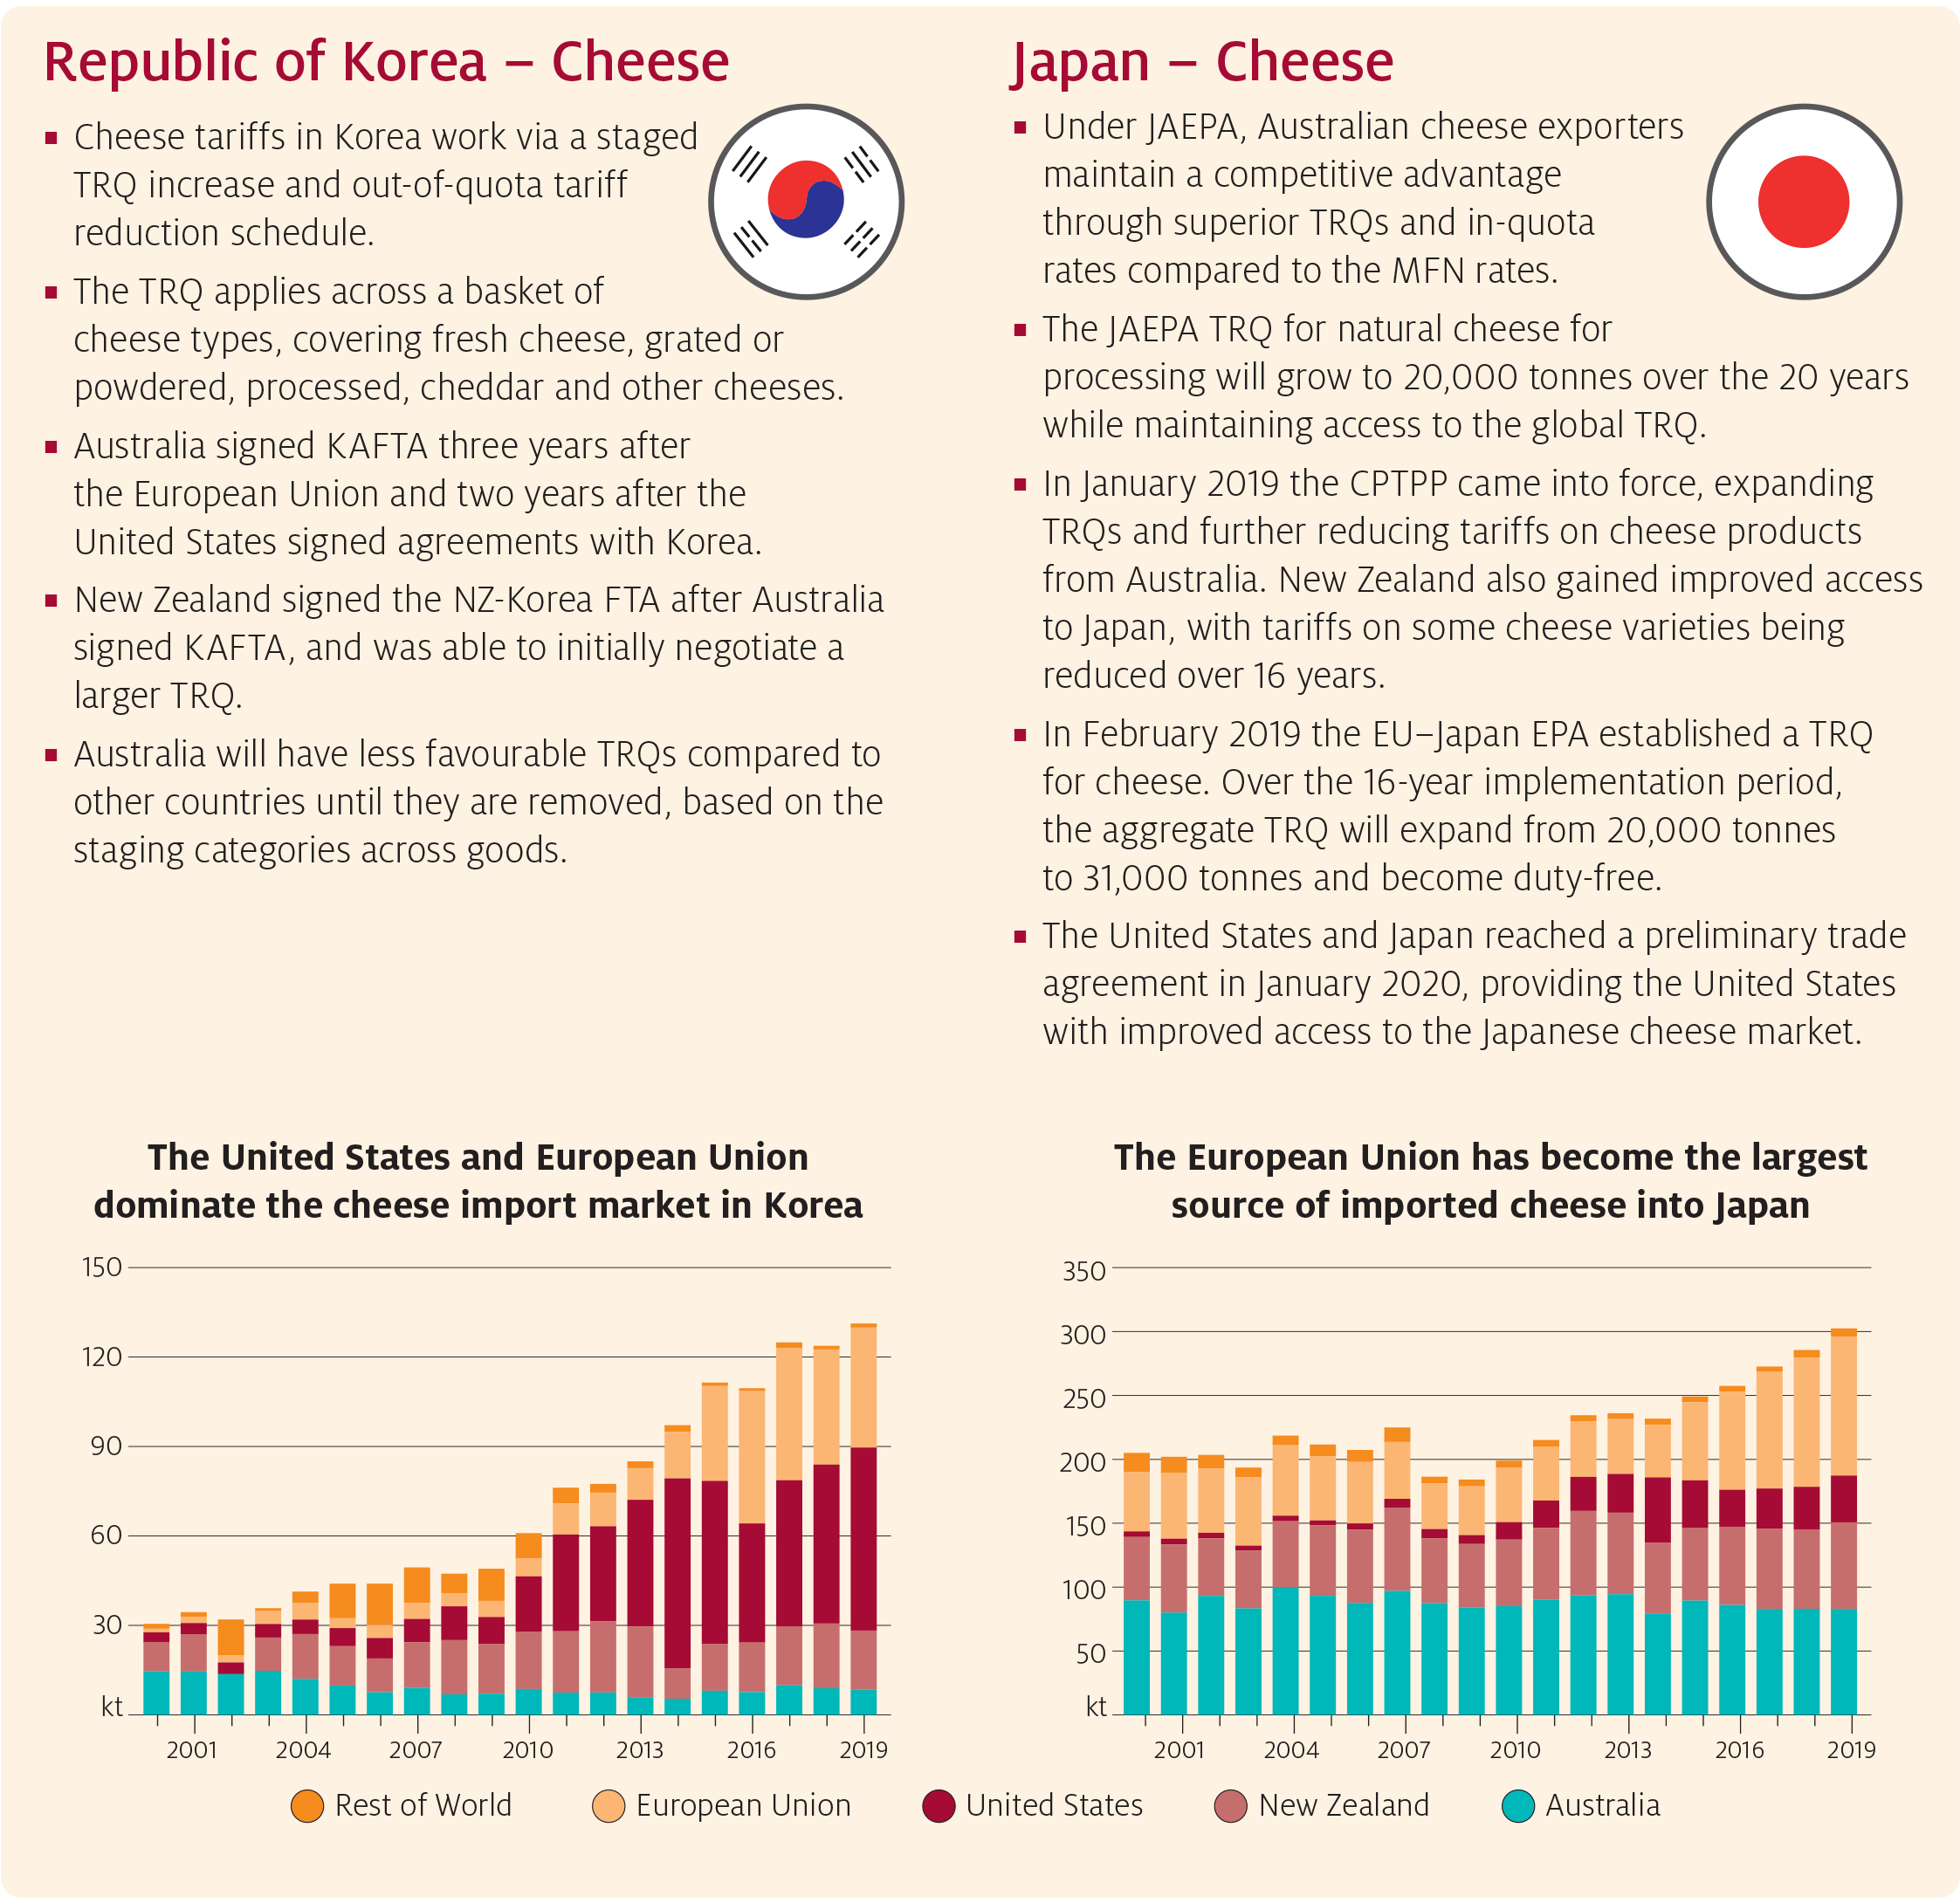
Source: DFAT 2020a; European Commission 2020; MFAT 2020; UN Statistics Division 2020; USDA‑FAS 2020; USTR 2019, 2020 Future challenges for trade negotiationsThe importance of FTAs to Australia's agricultural export performance cannot be overstated. Over the past 15 years they have provided access to new and growing markets, and have supported the competitiveness of our products abroad. There are only a few major trading partners that remain with which Australia does not yet have a preferential trade agreement. These include the European Union, the United Kingdom and India. Negotiations with these trading partners are underway and the pursuit of FTAs with new partners will remain of key importance to Australia's future trade agenda. With many agreements now in place, the Australian Government's trade strategy also includes reviewing existing FTAs and upgrading them where possible to ensure they continue to support our competitiveness. These improvements have increasingly addressed the emerging issues that have become more prominent in trade forums. Chief among those are technical trade issues, non-tariff measures (NTMs) in particular (Levantis & Fell 2019). NTMs impose costs on exporters and, while many can have a trade enabling impact, many are applied without a sound, evidence-based rationale. The potentially high cost of complying with such NTMs can act as a barrier to trade. Hence future trade negotiations will be increasingly about eliminating unjustly applied NTMs and on lowering the cost burden of other technical trade measures. Ultimately the priority for the Australian agricultural sector will continue to be about having access to export markets and being competitive in those markets. Ensuring Australia provides access to imported products will also be important for the competitiveness of our domestic industries. The negotiated removal of trade barriers, whether through our own FTAs or through those between other trading partners, will continue to support more efficient global value chains and a more liberalised global trading landscape (Greenville 2019). Ears of wheat and harvesting machine on background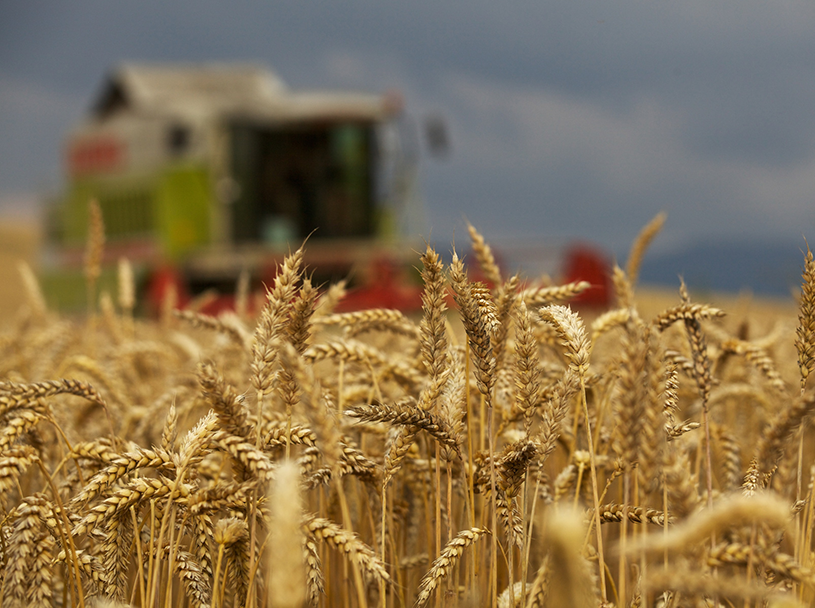
Photo: Shutterstock.com ReferencesABS 2020, Information Consultancy Service, 2007, cat. no. 9920.0, Australian Bureau of Statistics, Canberra. DFAT 2020a, Australia's free trade agreements (FTAs), Department of Foreign Affairs and Trade, Canberra. DFAT 2020b, Regional Comprehensive Economic Partnership (RCEP), Department of Foreign Affairs and Trade, Canberra. DFAT 2020c, Indonesia-Australia Comprehensive Economic Partnership Agreement: Outcomes, Department of Foreign Affairs and Trade, Canberra. DFAT 2019, Trade and Investment at a Glance 2019, Department of Foreign Affairs and Trade, Canberra. DS 2019, Sustainability Impact Assessment (SIA) in support of Free Trade Agreement (FTA) negotiations between the European Union and Republic of Indonesia, Development Solutions, Brussels. Eather, J, Hamshere, P, Moir, B 2013, What Asia Wants: Long-term food consumption trends in Asia, Australian Bureau of Agricultural and Resource Economics and Sciences, Canberra. European Commission 2020, Negotiations and agreements, Brussels. GAC 2020, Canada‑Korea Free Trade Agreement, Global Affairs Canada, Ottawa. Greenville, J 2019, Australia's place in global agriculture and food value chains, Australian Bureau of Agricultural and Resource Economics and Sciences, Canberra. ITC 2020, Market Access Map, International Trade Centre. Jackson, T, Zammit, K & Hatfield-Dodds, S 2020, Snapshot of Australian Agriculture, Australian Bureau of Agricultural and Resource Economics and Sciences, Canberra. Levantis, G & Fell, J 2019, Non-tariff measures affecting Australian Agriculture, Australian Bureau of Agricultural and Resource Economics and Sciences, Canberra. MFAT 2020, Free trade agreements, Ministry of Foreign Affairs and Trade, Wellington. Pollard 2008, A Hundred Years of Agriculture, Australian Bureau of Statistics, Canberra, accessed 22 June 2020. Thompson-Lipponen, C and J Greenville 2019, The Evolution of the Treatment of Agriculture in Preferential Trade Agreements, OECD Food, Agriculture and Fisheries Papers, No. 126, OECD Publishing, Paris. UN Statistics Division 2020, UN Comtrade Database, United Nations, New York. USDA-FAS 2020, Trade Agreements, United States Department of Agriculture Foreign Agricultural Service, Washington D.C. USTR 2020, Free Trade Agreements, Office of the United States Trade Representative, Washington D.C. USTR 2019, Fact Sheet on Agriculture-Related Provisions of the U.S.‑Japan Trade Agreement, Office of the United States Trade Representative, Washington D.C. WTO 2020a, Trade and tariff data, World Trade Organisation, Geneva. WTO 2020b, Regional Trade Agreements Database, World Tradewww Organisation, Geneva, accessed 26 June 2020. Download the report |
| URL | 查看原文 |
| 来源平台 | Australian Bureau of Agricultural and Resource Economics and Sciences |
| 文献类型 | 科技报告 |
| 条目标识符 | http://119.78.100.173/C666/handle/2XK7JSWQ/294180 |
| 专题 | 资源环境科学 |
| 推荐引用方式 GB/T 7714 | admin. ABARES Insights: Stocktake of Free trade, competitiveness and a global world: How trade agreements are shaping agriculture,2020. |
| 条目包含的文件 | 条目无相关文件。 | |||||
| 个性服务 |
| 推荐该条目 |
| 保存到收藏夹 |
| 查看访问统计 |
| 导出为Endnote文件 |
| 谷歌学术 |
| 谷歌学术中相似的文章 |
| [admin]的文章 |
| 百度学术 |
| 百度学术中相似的文章 |
| [admin]的文章 |
| 必应学术 |
| 必应学术中相似的文章 |
| [admin]的文章 |
| 相关权益政策 |
| 暂无数据 |
| 收藏/分享 |
除非特别说明,本系统中所有内容都受版权保护,并保留所有权利。


修改评论