Global S&T Development Trend Analysis Platform of Resources and Environment
| Australian rice markets in 2020 | |||||||||||||
| admin | |||||||||||||
| 2020-06-16 | |||||||||||||
| 出版年 | 2020 | ||||||||||||
| 国家 | 澳大利亚 | ||||||||||||
| 领域 | 资源环境 | ||||||||||||
| 英文摘要 | James Fell, James Frilay, Jared Greenville and Tim Westwood Rice in the newsRice supply in Australia has recently gained attention as consumer grocery spending accelerated with the onset of the COVID-19 pandemic. Retail spending increased by 8.5% in March 2020, predominately in the grocery sector (ABS 2020a). This created shortages in a number of products on supermarket shelves, including rice. It occurred at a time when Australian grown rice stocks and production were low due to poor seasonal conditions over the past few years. Rice production in Australia fluctuates significantlyRice production in Australia is highly variable, reflecting water availability and the prices of alternative crops. Rice is sown from October to December and harvested in March to May in southern New South Wales. Rice is a relatively minor crop in Australia and contributed around 0.4% of the total value of agricultural production in 2017–18 (ABS 2019a). Australian farmers have recently harvested approximately 57,000 tonnes of rice for the 2019–20 crop. Regionally important rice-growing centres are around Leeton, Griffith, Deniliquin and Coleambally. Most rice is grown in southern New South Wales. Australia also produces small volumes of rice in Queensland, Western Australia and the Northern Territory. Most of the rice produced in Australia is medium grain rice, the majority of which is exported. Ninety one percent of the 2019 harvest in southern New South Wales was medium or short grain varieties (Sunrice 2019). 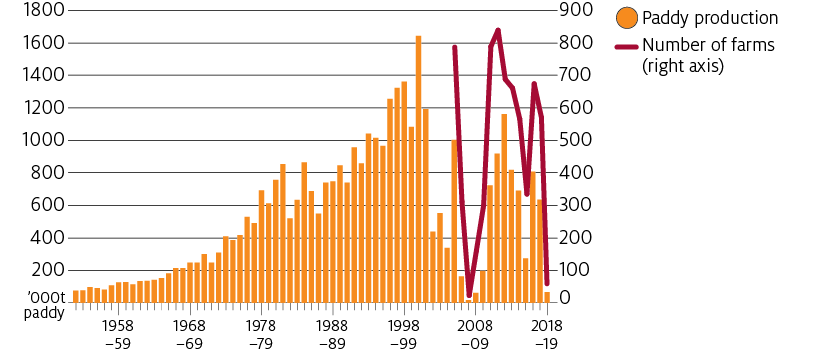
Rice producing farms have a broad output mixFarms that produce rice also typically produce other crops using irrigation water, such as cotton, pastures and perennial horticulture, as well as dryland crops such as wheat. Many also have beef and sheep enterprises. The relative profitability of enterprises that can be carried out on rice-producing farms varies from year to year with commodity and water prices and seasonal conditions. As farmers react to these changes, the number of farms producing rice varies substantially from close to no farms in dry years (2007–08) up to over 800 farms when seasonal conditions are better (such as 2011–12) (ABS 2019b). Changes in technology have also altered the profitability of rice compared with other enterprises on these farms. For example, in recent years, improved technology including new varieties have led to an increase in cotton plantings in southern New South Wales, which has had a downward influence on rice production. In 2017–18 farmers in southern New South Wales opted to plant more irrigated cotton than rice (ABS 2019b). The proportion of total farm receipts generated by rice in the years it is grown has fluctuated widely, from a low of around 5% in 2007–08 to a high of 45% in 2013–14. Over the 3 years to 2018–19 around 80% of the total cash receipts generated by rice-producing farms came from activities other than rice (ABARES, forthcoming). Rice-producing farms tend to own substantial volumes of water entitlements. On average, farms that grew rice in the Murrumbidgee region in 2017–18 held 3,030 ML of general security water entitlements. The average area sown to rice in this region was 148 hectares and the average volume of water applied to rice crops was 1,781 ML. The water available to rice farmers through general security allocations can vary dramatically year-to-year with seasonal conditions. General security allocations for the last ten years averaged 49% for the New South Wales Murray catchment and 52% for the Murrumbidgee catchment. However, in the three years to 2019-20 dry seasons have meant that allocations have averaged 17% for the NSW Murray and 21% for the Murrumbidgee. Rice producing farms that own water licences have the choice of using water allocations for production, or selling them on the temporary water market. Most rice-producing farms are active participants in water markets—88% of farms that grew rice in the Murrumbidgee region and 48% of those in the Murray region were buyers or sellers of water in 2017–18 (ABARES forthcoming). Typically when water prices are low farms that produce rice purchase water allocations and when prices are high they sell water allocations. 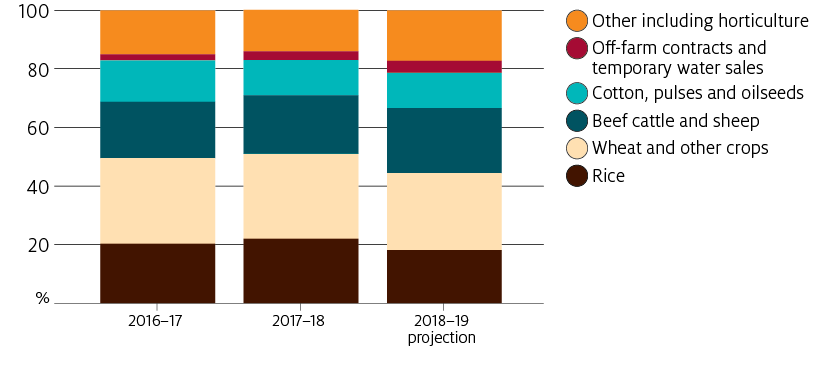
Rice production expected to improve in 2020–21The latest Bureau of Meteorology seasonal outlook suggest that water availability is likely to improve in 2020–21, lifting the volume and value of irrigated crops such as rice. ABARES forecasts that a return to average seasonal conditions and a fall in water prices would lead to an increase in rice production, from 57,000 tonnes in 2019–20 to around 266,000 tonnes in 2020–21, still well below the 10 year average to 2018-19 of 629,000 tonnes. Most of the forecast production in 2020–21 (around 257,000 tonnes) is forecast to be grown in the southern Murray–Darling Basin, where a very wet year would be needed for production to return to over 400,000 tonnes. 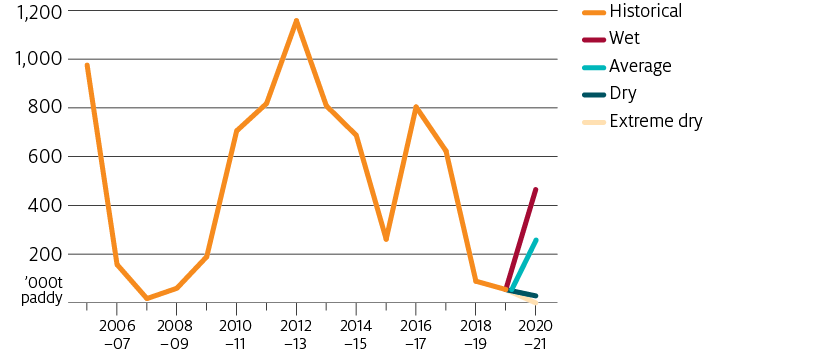
Over the longer term, fundamental changes in demand for water and relatively low returns from rice production mean that Australia is likely to grow less rice. Instead, water will be reallocated to crops generating higher returns. This type of structural adjustment raises the value of the agriculture sector as a whole, but may reallocate activity to different communities. Australia exports most of its riceAustralia exported an average of 350,000 tonnes per year of rice between 2010–11 and 2019–20, with significant year-to-year variability as production varied. In recent years around 74% of the crop was exported, but this percentage varies from season to season. Australia is a small exporter of mostly medium grain rice, representing around 5% of global medium and short grain rice exports and 0.4% of total global rice exports in 2019. Globally, Australia competes primarily with China and the United States in medium grain rice markets. The main export destinations are the Middle East and Oceania. 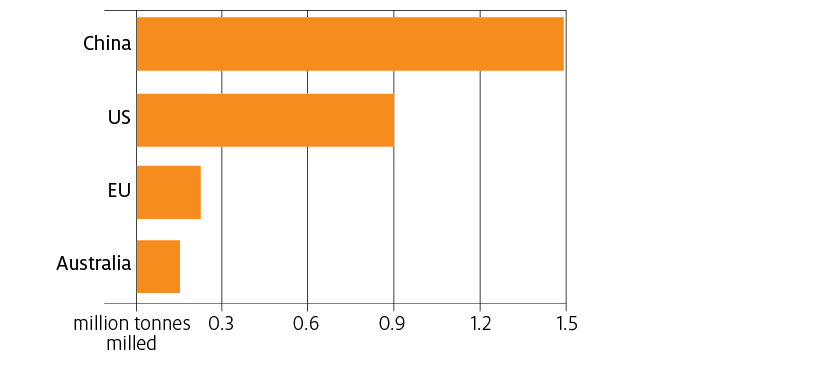
Sources: ABARES (2020b); China Customs (2020); European Commission (2019); USDA-FAS (2020) 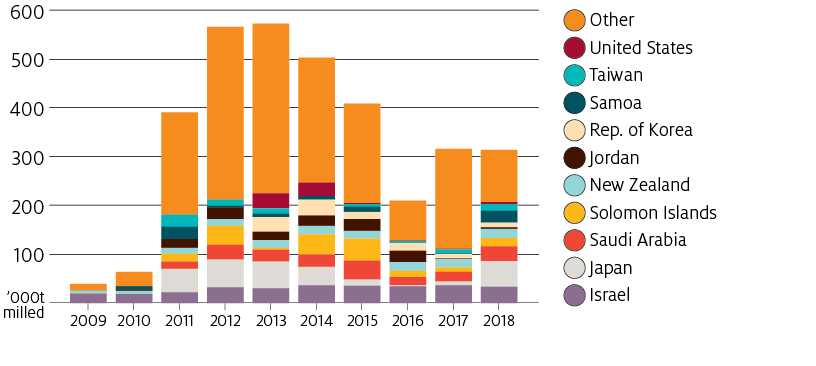
Sources: ABARES (2020b); UN Statistics Division (2020) Rice export marketingAustralia's rice exports are regulated through a mandated export monopoly in New South Wales. Historically, there had been over 60 state and federal statutory marketing boards for agricultural products, with the arrangements for rice the last remaining. There have been arguments for and against regulating the marketing of rice exports. In a broad inquiry into agricultural regulation, the Productivity Commission (2016) concluded that the persistence of a statutory export monopoly for rice is likely to reduce marketing flexibility and unnecessarily add to marketing costs. With no premium evident in the price of Australian rice imported into other countries, the Commission recommended that rice vesting be abolished. In contrast, a review by the New Wales Department of Primary Industries (NSWDPI 2016) found a price premium of between $65 and $120 per tonne, and recommended that rice vesting continue until 2022. This recommendation was accepted by the government of New South Wales. A key difference between this and the Productivity Commission’s analysis was that the proximity to markets, quality differences, scale efficiencies and foreign import quotas were attributed as benefits of rice vesting. Domestic marketing of rice was deregulated in 2006. Since then domestically grown and processed rice now competes openly with imported rice. Imports are an established part of Australian rice consumptionAustralians are estimated to consume about 300,000 tonnes of rice every year (ABARES 2019). About half of this volume typically comes from imports (mostly long grain rice, such as basmati and jasmine) and the other half from domestic production (mostly medium grain rice). Australia’s imports represent 0.4% of world trade, meaning that changes in Australian import volumes result in no material change to world markets. Australia relies on rice imports every year, reflecting prices and consumer preferences for varieties of rice that are not grown in Australia. Annual rice imports between 2009–10 and 2018–19 averaged 173,000 tonnes (ABS 2020b). Most imports originate from long grain rice producing countries, subject to strict biosecurity protocols. Australia can also import medium grain rice in years of drought. While Australian rice production is highly variable, consumption and imports are more stable. This is because exports and domestic stocks act as a shock absorber—exports increase in good production years and decrease in poor production years (ABARES 2020a). ABARES estimates that at 1 April 2020 rice stocks in Australia were 140,000 tonnes. This includes importers' stocks and Sunrice's domestic stocks. Since domestically produced rice is harvested in autumn—once per year—no new domestic supply will be available in Australia until 2021. Therefore, any short-term rice shortages can only be alleviated through imports. 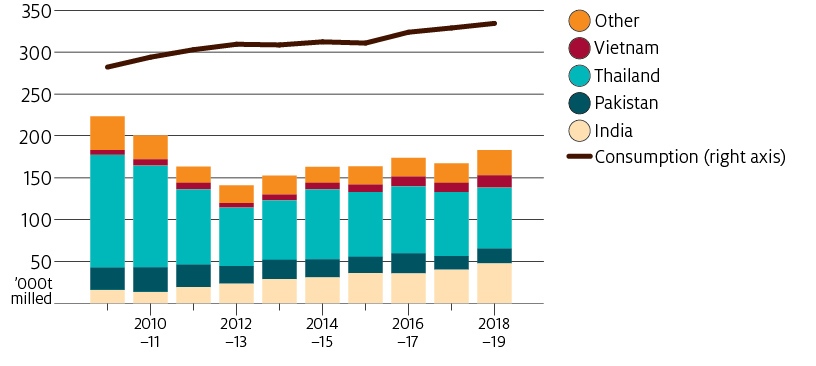
Abundant world supply of riceGlobally, an ample supply of rice is currently available (International Grains Council press release, 15 April 2020). World rice stocks are the highest they have ever been, including in major exporting countries. Some export restrictions were recently introduced in South-East Asia, namely in Cambodia, Myanmar and Vietnam. Australia only imports small volumes from these countries. These export restrictions have now been repealed. Although the price of rice has been rising in Thailand—a country that has not recently proposed restricting exports—this trend is largely the result of drought and the consequent forecast fall in production. In contrast, the price of rice in India—the world's largest exporter—has been averaging around US$400 per tonne, roughly unchanged for much of the last decade (IGC 2020). 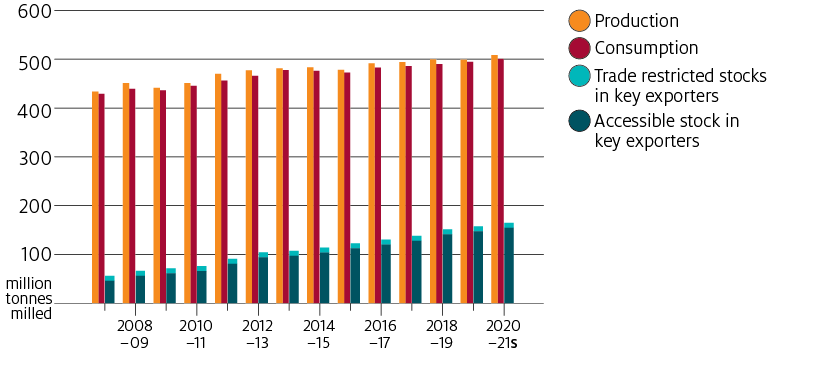
Sources: Food Corporation of India (2020); IGC (2020) ReferencesABARES forthcoming, ABARES Murray–Darling Basin Irrigation Survey, Australian Bureau of Agricultural and Resource Economics and Science, Canberra. —— 2020a, Analysis of Australian food security and the COVID-19 pandemic, Australian Bureau of Agricultural and Resource Economics and Sciences, Canberra. ——2020b, Agricultural commodities, March 2020, Australian Bureau of Agricultural and Resource Economics and Sciences, Canberra. ——2020c, Water market outlook, March 2020, Australian Bureau of Agricultural and Resource Economics and Sciences, Canberra. ——2019, Agricultural commodity statistics, 2019, Australian Bureau of Agricultural and Resource Economics and Sciences, Canberra. ABS 2020a, Retail Trade, Australia Mar 2020, cat. no. 8501.0, Australian Bureau of Statistics, Canberra. ——2020b, International Trade, Australia - Information Consultancy Subscription Service, 2000, cat. no. 5465.0, Australian Bureau of Statistics, Canberra. ——2019a, Value of Agricultural Commodities Produced, Australia, 2017–18, cat. no. 7503.0 Australian Bureau of Statistics, Canberra. ——2019b, Agricultural Commodities, Australia, 2017–18, cat. no. 7121.0, Australian Bureau of Statistics, Canberra. ——2019c, Water Use on Australian Farms, 2017–18, cat. no. 4618.0, Australian Bureau of Statistics, Canberra. ——2018, International Merchandise Trade, Australia: Concepts, Sources and Methods, 2018, cat. no. 5489.0, Australian Bureau of Statistics, Canberra. China Customs 2020, China Customs trade database, China Customs, accessed 21 April 2020. Food Corporation of India 2020, Foodgrains Stocking Norms, Government of India, New Delhi. European Commission 2019, EU Rice Supply & Demand, European Commission, Brussels, November. IGC 2020, Online database, International Grains Council, London, accessed 21 April 2020. NSWDPI 2016. Review of rice vesting proclamation. New South Wales Department of Primary Industries, Sydney. Productivity Commission 2016, Regulation of Australian Agriculture, report no. 79, Canberra. Sunrice 2019, Riverina grower meetings presentation 20-21 June 2019 (pdf 3.59MB), Ricegrowers Limited, Leeton, New South Wales. UN Statistics Division 2020, UN Comtrade Database, United Nations, New York, accessed 21 April 2020. USDA-FAS 2020, Global Agricultural Trade System, United States Department of Agriculture Foreign Agricultural Service, Washington D.C., accessed 21 April 2020. Download
If you have difficulty accessing these files, please visit web accessibility. | ||||||||||||
| URL | 查看原文 | ||||||||||||
| 来源平台 | Australian Bureau of Agricultural and Resource Economics and Sciences | ||||||||||||
| 文献类型 | 科技报告 | ||||||||||||
| 条目标识符 | http://119.78.100.173/C666/handle/2XK7JSWQ/276861 | ||||||||||||
| 专题 | 资源环境科学 | ||||||||||||
| 推荐引用方式 GB/T 7714 | admin. Australian rice markets in 2020,2020. |
| 条目包含的文件 | 条目无相关文件。 | |||||
| 个性服务 |
| 推荐该条目 |
| 保存到收藏夹 |
| 查看访问统计 |
| 导出为Endnote文件 |
| 谷歌学术 |
| 谷歌学术中相似的文章 |
| [admin]的文章 |
| 百度学术 |
| 百度学术中相似的文章 |
| [admin]的文章 |
| 必应学术 |
| 必应学术中相似的文章 |
| [admin]的文章 |
| 相关权益政策 |
| 暂无数据 |
| 收藏/分享 |
除非特别说明,本系统中所有内容都受版权保护,并保留所有权利。


修改评论