Global S&T Development Trend Analysis Platform of Resources and Environment
| Analysis of Australian agricultural trade and the COVID-19 pandemic | |
| admin | |
| 2020-06-05 | |
| 出版年 | 2020 |
| 国家 | 澳大利亚 |
| 领域 | 资源环境 |
| 英文摘要 | Authors: Jared Greenville, Heather McGilvray and Stephanie Black. 
IntroductionAustralia’s agricultural trade has by and large continued unhindered by the COVID-19 pandemic. But for some sectors, such as those closely associated with food service and those reliant on air freight, there were some significant disruptions. The Australian Government and industry continue to work together to ensure that Australia’s trade profile remains strong and is able to take advantage of a global economic and health-based recovery as quickly as possible. [expand all]Demand for essential food products is stable and will likely see less impact than other sectorsInitially the impacts of the COVID-19 outbreak on Australia’s agriculture, forestry and fisheries sectors were limited to slowing demand in China. The subsequent global spread of the virus is now impacting on global markets, extending the scope of possible impacts on the sector. The International Monetary Fund (IMF) is currently forecasting a 3% contraction in global economic activity in 2020—worse than the global financial crisis (IMF 2020). For many Australian agricultural sectors, this is the first time in recent years that markets are experiencing price movements driven by falling demand rather than production induced supply changes (for example drought or cyclones). 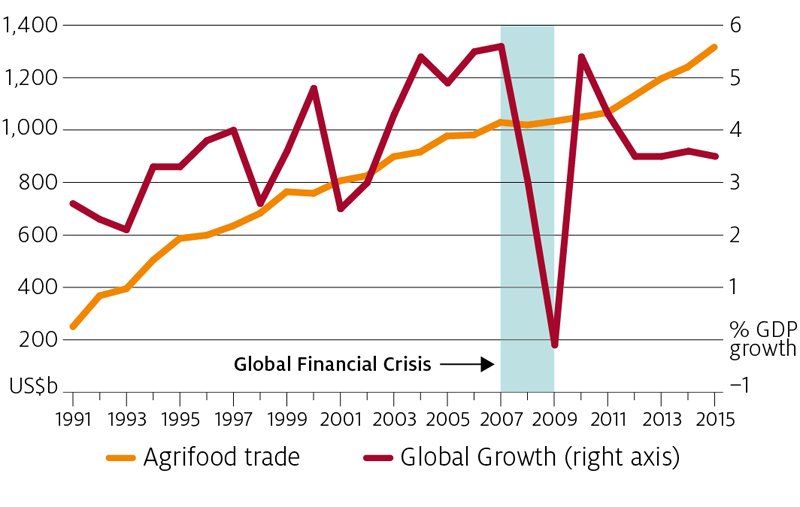
Source: Greenville et al. (2019), IMF. A similar conclusion has been reached by the World Trade Organisation (WTO) who on 8 April 2020, published three scenarios for a global recovery in world trade, termed: V-shaped, with a short-term recovery of only 3 months, U-shaped, with slightly longer recovery of 6 months, and L-shaped, mapping potential impacts from a longer recovery timeline of over 12 months (WTO, 2020a). Across the three scenarios, world merchandise trade volume is expected to fall between 13% and 32% in 2020. The value of global trade is expected to fall between 8% and 20% (Figure 2). 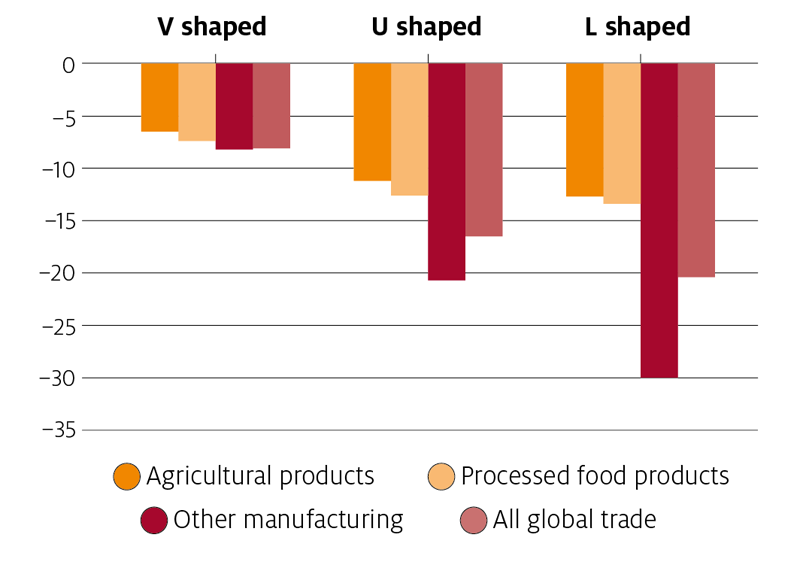
In line with observations from the 2008-09 global financial crisis, the agricultural products and processed food sectors are expected to experience smaller trade impacts than all other sectors (excepting health related sectors). However, prices for products are softeningNot all products from the agriculture, forestry and fisheries sectors are essential items. As economic activity declines and global incomes are reduced, products consumed through more discretionary spending will be more significantly affected. These include high quality foods for cafés and restaurants. These effects were seen for seafood where the outbreak in China has been estimated to have led to a fall in export earnings of around $200 million in 2019–20 (Mobsby et al. 2020). High quality and food service-based products that cannot easily be transitioned between market segments are likely to be most strongly affected. Indeed, there are reports from the red meat sector that transitioning high valued product from the food service sector to the retail sector is not viable in a number of export markets due to high transport costs and the sharp decline in prices received. Notably, the need to transition between market segments is not limited to food service sectors. In Indonesia for example the lack of access for consumers to wet markets has caused a transition away from beef from feed lots to more packaged products sold through supermarkets. For Australian exporters to Indonesia, there has been a slowdown in live trade but an increase in meat exports. Some of the reduced demand previously targeted at food service has been diverted to the supermarket and other retail sectors. However, for some exports, the price differential between market segments will be too significant and the demand volumes insufficient to compensate for consumption from food services (Passport Euromonitor International, 2020). For products which feed exclusively into manufacturing supply chains, such as cotton, wool and wood products, the impacts will depend on the extent and length of closures of manufacturing businesses and any disruption to the construction sector. The impact on these industries from falling consumer incomes will be more significant as consumers delay purchases of new clothes and other durable goods. Underlying all these trends, Australia’s exchange rate has also fallen during the pandemic. The falling exchange rate is making Australian products more competitive in world markets and is helping to offset some of the downturn in world prices. Supply chains and logistics disruptions are benefiting from government and industry responsesThere are four key points of risk that have been identified in Australia’s export supply chain during the COVID-19 pandemic. Currently all four elements are either not considered to be impeding Australia’s trade position or have been the focus of direct government and industry responses to ease constraints (Figure 3). Despite the risks, overall export performance has remained strongOfficial trade data indicates that, despite the pandemic, most agricultural exports have continued to leave Australia and reach consumers in international markets. Export levels have been on par with what would have otherwise been expected during early 2020 (Table 1). Where results are down on 5-year average levels, it is generally attributable to reasons other than COVID-19, such as the effect of drought on domestic production. Seafood exports are a significant exception, experiencing a significant decline in exports in February 2020. This was due to an unfortunate alignment of the spreading pandemic and peak export periods for some species. However, not all reduced export revenue will be lost. There is some potential for catch-up exports in 2020–21. There have also been declines in the export of skins and hides since the start of 2020. Declining live animal exports is also a watch point as the pandemic continues to evolve and demand from Vietnam and Indonesia softens. 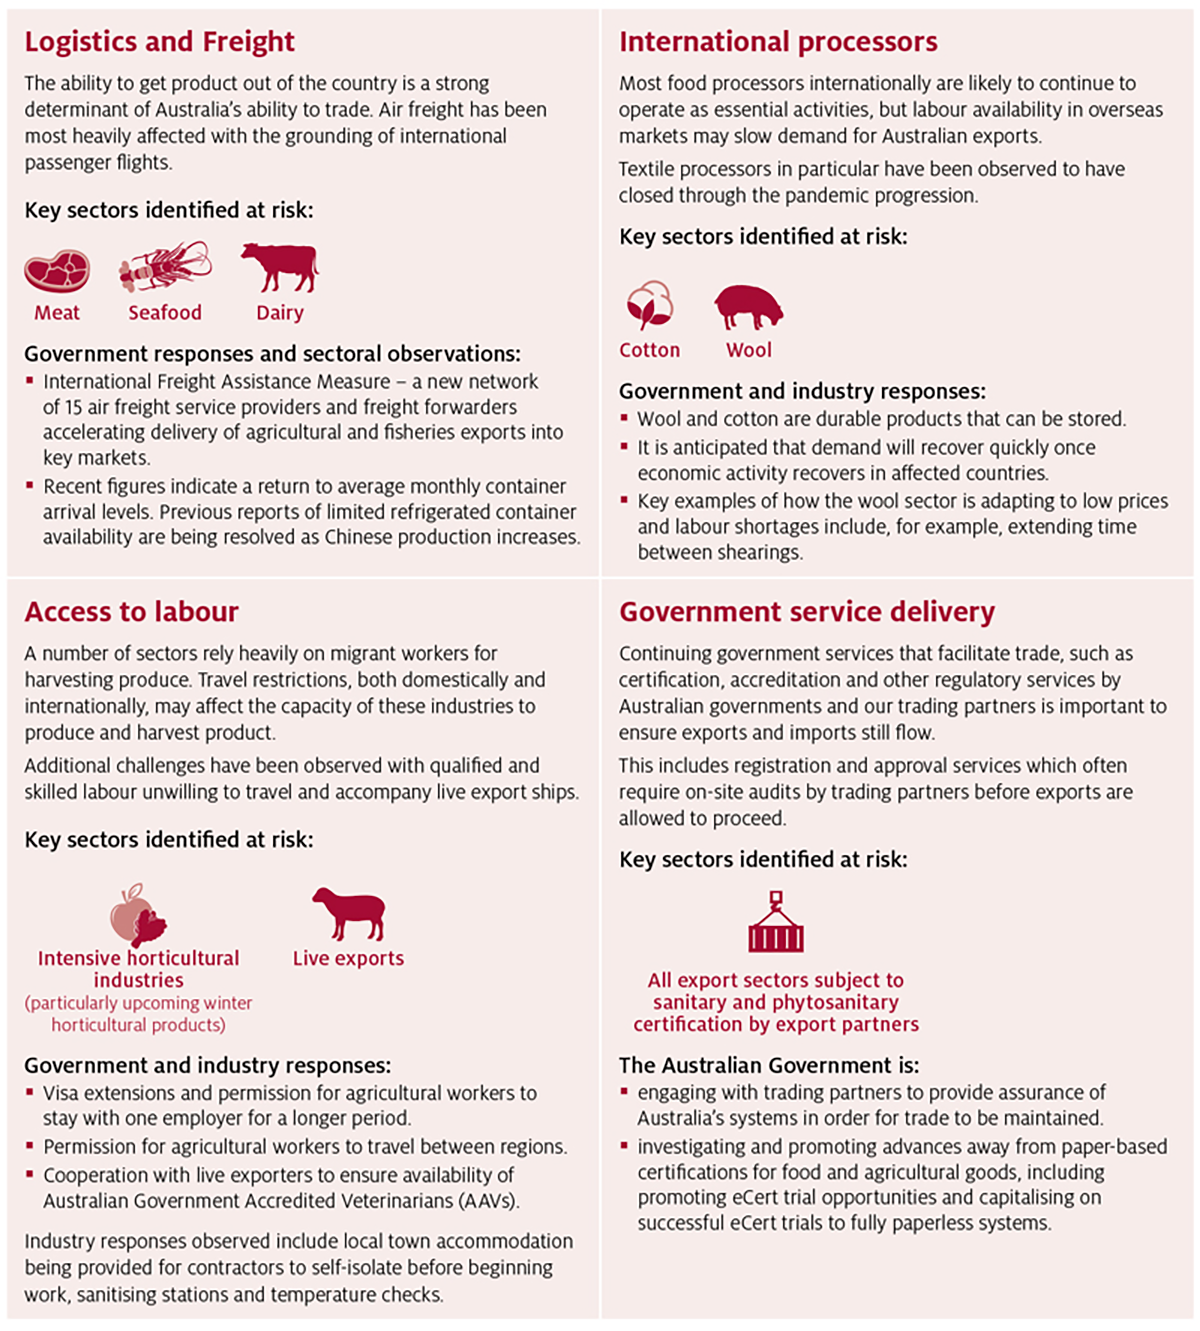
Notes: Green—Exports proceeding as expected (note: exports may still be down on average, but due to other factors). Orange—Signs of impact on exports as a result of COVID–19. Supplies of imported imports have also been maintainedDespite the COVID-19 pandemic, Australia's agricultural sector has not been compromised by lack of access to imported inputs. China is Australia’s largest input supplier, followed by the US, Europe and New Zealand. As of January, supplies have been maintained. However, as further limits to transporting materials and the functioning of workplaces are expected outside of China, this situation may have an impact on production and harvest this season. 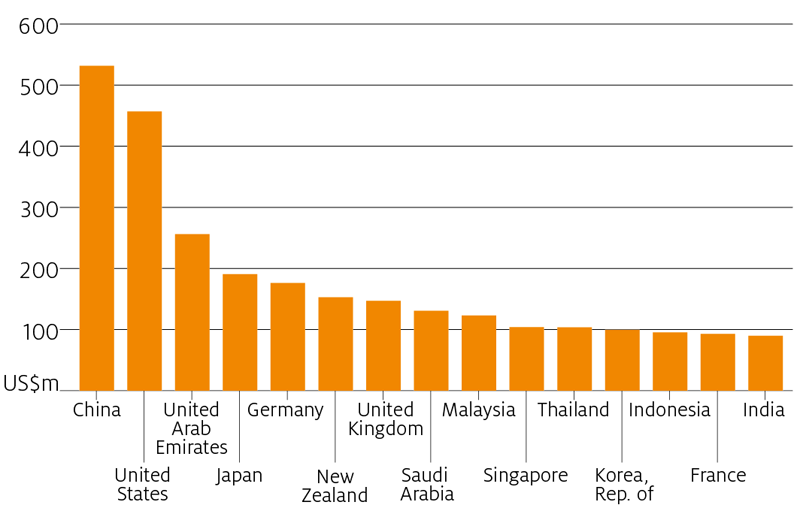
Source: Greenville (2019) Despite the potential for disruption, recent ABS trade data indicate that imports of important inputs to the agriculture sector have continued as expected. January to March import values for chemical and fertiliser are lower than the 5-year average due to drought related conditions having reduced demand. Prices for some fertilisers have also been lower than in previous years, further lowering year to date import values. Drought conditions have also influenced growth in stockfeed import values (Figure 5). 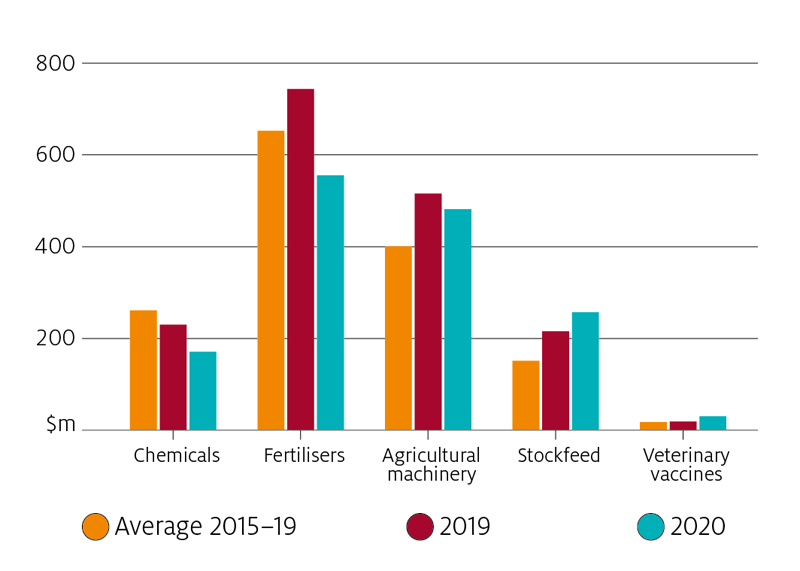
Industry reports suggest that supply chains have been able to respond to increased demand in recent months as seasonal conditions have improved. There are risks associated with insular trade policy responsesWith over 70% of agricultural production exported (Jackson et al. 2020) and close to 50% of employment in the sector derived from trade (Greenville 2019; Greenville et al. 2019), Australia more than most countries is reliant on an open global trading environment. Australia has benefited from the global reduction in distortionary trade and domestic support policies, leveraged through commitments under the WTO Agreement on Agriculture, along with the expansion in its membership to include China. However, in recent years progress on global agricultural distortions have stalled and there is a risk that some recent policy responses may linger. The risks associated with creeping protectionism linked to the COVID-19 pandemic should be carefully considered and actively worked against. Global trade relations work to stabilise the global food supply chain and allow for greater risk mitigation and lower prices at regional and country levels. Creeping protectionism has the potential to exacerbate and prolong food supply shortages and price fluctuations. As at the 23rd of April 2020, the WTO had registered a growing number of countries and separate customs territories that had introduced export prohibitions or restrictions as a result of the COVID-19 pandemic – a total of 80, including 46 WTO members (72 if EU member states are counted individually) and eight non-WTO members. The International Food Policy and research Institute (IFPRI) also found that 5 per cent of the world’s traded calories were affected by export restrictions in April 2020. None of Australia’s imported food stuffs have been affected by these export restrictions to date (Laborde, D et al. 2020). The Australian government and the G20 are well aware of the risks to global food security and global food prices should protectionism gain a stronger hold in the aftermath of the COVID-19 pandemic. On the 21st of April 2020, G20 Agriculture Ministers met to reaffirm the need for continued flow of food, products and inputs for agriculture (G20 2020). Any shift in trade settings towards self-sufficiency and protectionism risks jeopardising the global advances that have been made in the trade setting over the past 20 years. Increasing diversity in value chains can offer improved risk mitigationThe pandemic has highlighted issues around concentrated supply chains for certain goods and services. That is, where countries and sectors have a heavy dependence on single markets, export pathways and/or suppliers. The recent trend to a hub system in agri-food trading has been a driver of this concentration. For the period 2004–2014, almost 45 per cent of growth in agriculture and food exports used as inputs to other country exports was concentrated in just six countries (Figure 6). 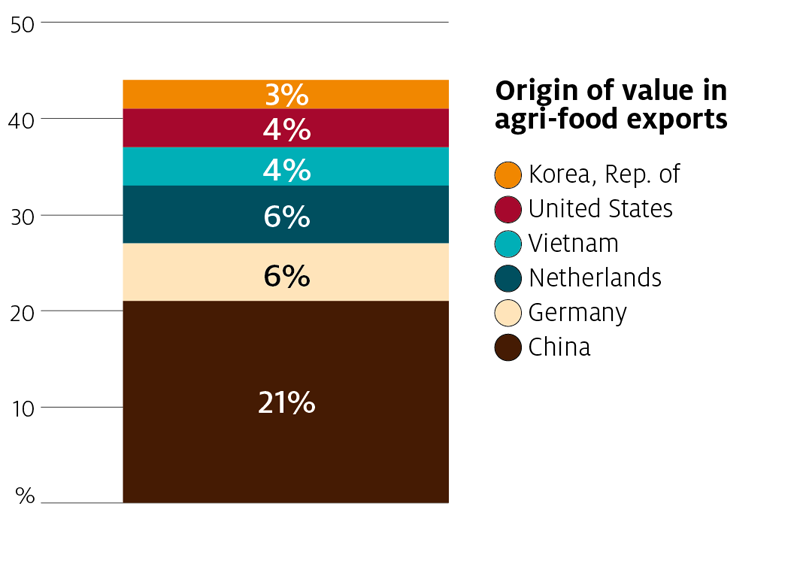
Increasing diversification in supply chains has been discussed widely in response to identified bottle necks and disruptions to international trade. They are not equivalent to protectionist policies. A diversified supply chain, which includes domestic and multiple international options for imported inputs and export markets, allows for risk mitigation and continuity of supply in almost all situations. Recent OECD analysis has shown that in some cases greater diversity in supply chains, in terms of both products and locations, boosted competitiveness and market performance (Greenville, J. et al. 2019). Ultimately, having as broad a base as possible in import and export pathways provides the best conditions for diversified supply chains. These would be best achieved through multilateral efforts to eliminate trade barriers, but also supported through an FTA agenda focused on imports as well as exports. Recovery involves a number of different possibilitiesHow well Australia recovers will depend on both international market conditions and how it responds to some of the potential lasting changes from the COVID-19 pandemic. Overall it is expected that most of the key settings governing agricultural trade will remain unaffected by the COVID-19 pandemic. Food will mostly continue to be processed close to the final consumer, and Australian agriculture will continue to participate in global value chains, both for bulk products, but also for more consumer-facing products. However, the pandemic is driving some changes that will likely remain part of the future trade landscape. These include shifts in consumer buying towards more online sales, higher demand for stable and safe food, a greater awareness of supply chain risks, increased use of digital trade systems and the risk of creeping protectionism. These will impact our main markets in different ways. The prospects for recovery for Australian agricultural trade are good. Australia’s agricultural sector and trade profile have a long history of adaptation, evolution and growth in the face of external challenges and pressures. There are already encouraging signs that this strong starting point, coupled with a strong public health and government policy response to the pandemic will put Australian agricultural trade in a good position to maintain its overall trade profile during the pandemic and to take advantage of a global economic recovery quickly. ReferencesG20 (2020) G20 Extraordinary Agriculture Ministers Meeting. Ministerial Statement on COVID-19. Virtual Meeting – April 21, 2020. Meeting Statement. Retrieved from https://g20.org/en/media/Documents/G20_ Agriculture%20Ministers%20Meeting_Statement_ EN.pdf Greenville, J. (2019) Australia’s place in global agricultural and food value chains, Australian Bureau of Agricultural and Resource Economics and Sciences, Canberra. Greenville, J., K. Kawasaki and M. Jouanjean (2019), "Dynamic Changes and Effects of Agro- Food GVCS", OECD Food, Agriculture and Fisheries Papers, No. 119, OECD Publishing, Paris, https://doi. org/10.1787/43b7bcec-en. IMF (2020) World Economic Outlook, Chapter 1: The Great Lockdown, International Monetary Fund, April 2020, Washington, D.C. Jackson, T., K. Zammit and S. Hatfield-Dodds (2020) Snapshot of Australian Agriculture 2020, Australian Bureau of Agricultural and Resource Economics and Sciences, Canberra Laborde, D. et al (2020) Documentation for the COVID-19 Food trade Policy Tracker: Tracking Government Responses Affecting Global Food Markets during the COVID-19 Crisis Mobsby, D, Steven A & Curtotti, R (2020) ‘Australian fisheries and aquaculture outlook 2020', in Agricultural commodities: March quarter 2020, Australian Bureau of Agricultural and Resource Economics and Sciences, Canberra Passport Euromonitor International (2020) The Impact of Coronavirus on FMCG and Service Sectors in China. Retrieved from https://go.euromonitor.com/ white-paper-hw-2020-coronavirus.html WTO (2020a) Trade set to plummet as COVID-19 pandemic upends global economy: Press release. Retrieved from https://www.wto.org/english/ news_e/pres20_e/pr855_e.htm WTO (2020b) Methodology for the WTO trade forecast of April 8 2020. Retrieved from https://www.wto.org/english/news_e/pres20_e/ methodpr855_e.pdf WTO (2020c) Export prohibitions and restrictions: Information Note. Retrieved from https://www.wto.org/english/tratop_e/covid19_e/ export_prohibitions_report_e.pdf Download the reportABARES Insights: Analysis of Australian agricultural trade and the COVID-19 pandemic – PDF [0.69 MB] |
| URL | 查看原文 |
| 来源平台 | Australian Bureau of Agricultural and Resource Economics and Sciences |
| 文献类型 | 科技报告 |
| 条目标识符 | http://119.78.100.173/C666/handle/2XK7JSWQ/273518 |
| 专题 | 资源环境科学 |
| 推荐引用方式 GB/T 7714 | admin. Analysis of Australian agricultural trade and the COVID-19 pandemic,2020. |
| 条目包含的文件 | 条目无相关文件。 | |||||
| 个性服务 |
| 推荐该条目 |
| 保存到收藏夹 |
| 查看访问统计 |
| 导出为Endnote文件 |
| 谷歌学术 |
| 谷歌学术中相似的文章 |
| [admin]的文章 |
| 百度学术 |
| 百度学术中相似的文章 |
| [admin]的文章 |
| 必应学术 |
| 必应学术中相似的文章 |
| [admin]的文章 |
| 相关权益政策 |
| 暂无数据 |
| 收藏/分享 |
除非特别说明,本系统中所有内容都受版权保护,并保留所有权利。


修改评论