Global S&T Development Trend Analysis Platform of Resources and Environment
| China’s Overseas Lending: A Response to Our Critics | |
| admin | |
| 2020-05-07 | |
| 发布年 | 2020 |
| 语种 | 英语 |
| 国家 | 加拿大 |
| 领域 | 地球科学 |
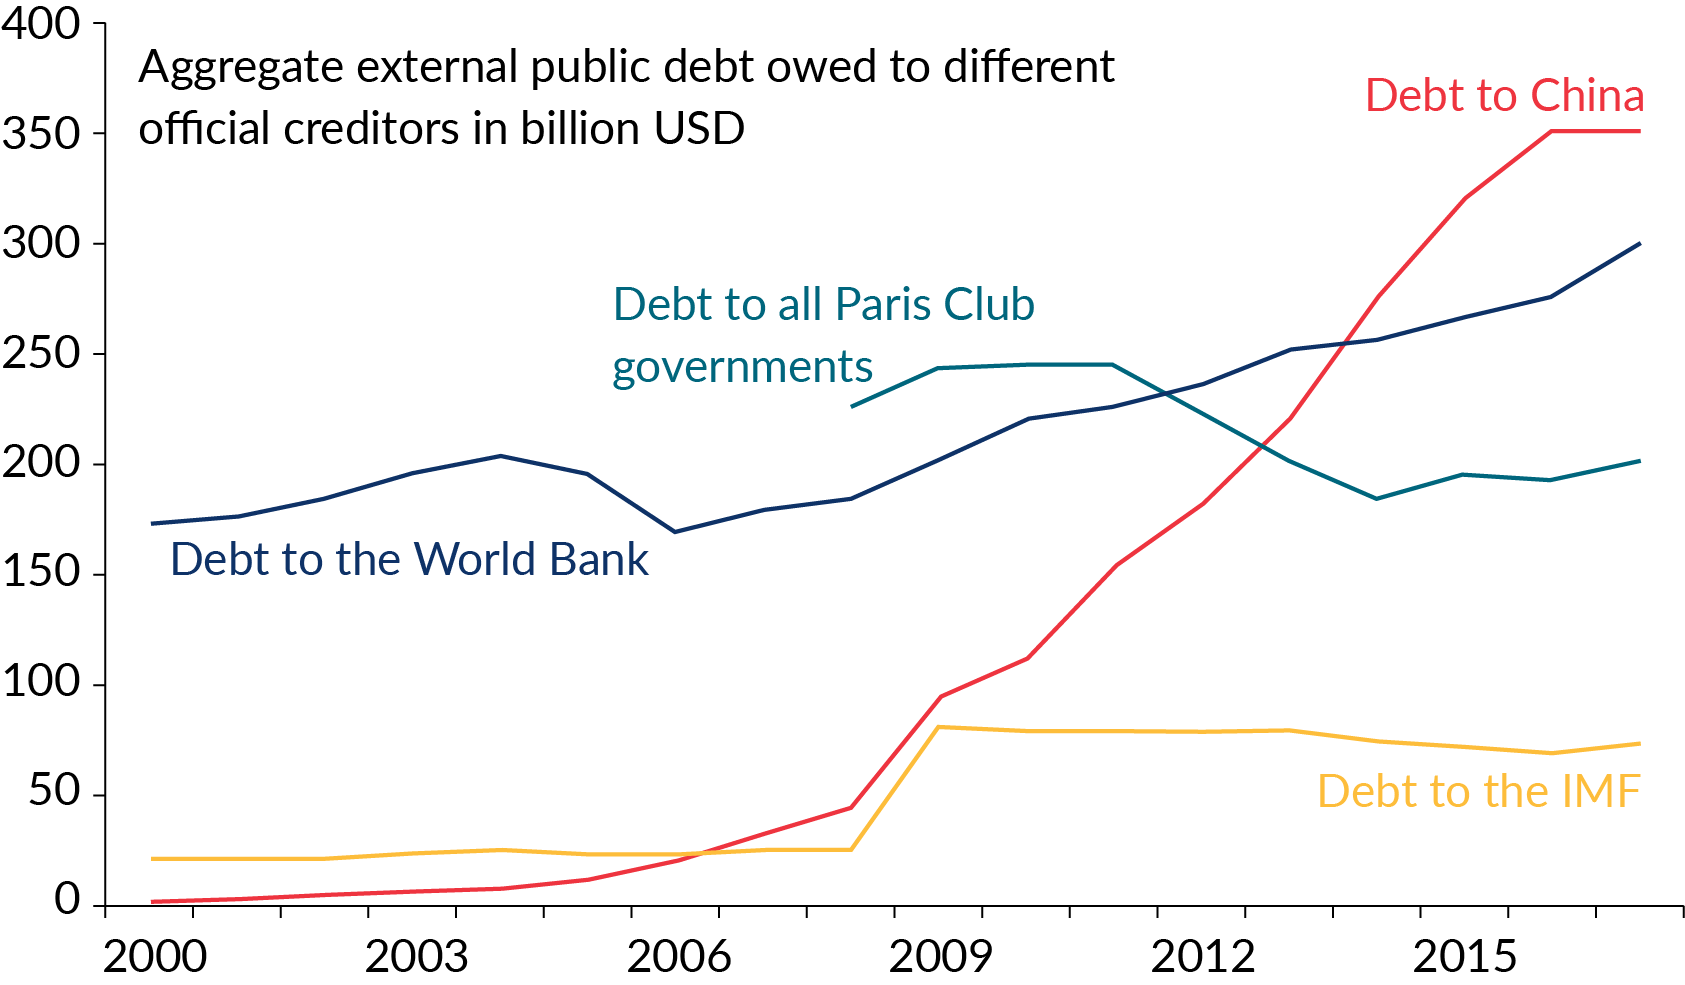
| 正文(英文) | In an accompanying blog, Scott Morris introduces this note and why it's an important contribution as the world grapples with a potential debt crisis. Debt relief in the wake of COVID-19 must encompass loans owed to ChinaOver the past two decades, China has become a major global lender, with outstanding debt claims from direct loans and trade advances alone exceeding 1.5 percent of world GDP. This surge in lending has financed many projects in infrastructure, mining, and energy. The problem is that there is little official data beyond those aggregate numbers, mainly because China has not released a breakdown of its lending activities. In Horn, Reinhart, and Trebesch (2019), we address these data shortcomings and construct a database of Chinese loans with corresponding debt service and debt stock estimates by country and year. Our “consensus dataset” is granular and was gathered from an extensive list of sources, including international treaties, debt contracts, policy reports, as well as the work of academics such as the AidData team at William and Mary (Dreher et al. 2017). We collated details on 5,000 loans and grants extended by the Chinese government and state-owned creditor agencies since 1949, to more than 150 countries worldwide, with total commitment amounts of US$520 billion. Our research shows that China is now the biggest official creditor to developing countries (see Figure 1). With a view to the current situation, this means that any effort to provide meaningful debt relief to the most vulnerable countries in the wake of COVID-19 must encompass the debts owed to China. To date, China has restructured its debt in a piecemeal approach (case by case, involving only the debtor government) while the Paris Club governments, the World Bank, the IMF, and private investors have taken part in coordinated and comparatively well-documented debt relief initiatives. For debt relief to be effective, it must be closely coordinated with China in the ongoing crisis. Furthermore, the need for transparency is at a premium, as governments and private creditors demand assurance that the debt relief is channeled to confront the COVID-19 pandemic and not to repay pre-existing debts to China. Figure 1. China is the largest official creditor to developing countries
Note: This figure shows aggregate public debt to different official creditors for all 122 developing and emerging market countries contained in the World Bank International Debt Statistics (excluding China). Debt to China is estimated by Horn, Reinhart and Trebesch (2019). Debt to all 22 Paris Club governments is taken from the Paris Club website (available since 2008). Debt to the IMF and the World Bank Group (IBRD plus IDA) is from the World Bank's International Debt Statistics. Why our debt estimates are likely a lower boundOur paper has contributed to a debate on the true scope of Chinese lending. A recent report by the IMF and World Bank (2020), for example, uses data from 14 low-income countries and suggests that our debt stock estimates may be too large and “that any hidden debt may be smaller” than what we report. The report asserts that our estimates are largely based on loan commitments rather than disbursements, which could lead to an upward bias. We respond to this criticism in four points, below. In a separate appendix, we also respond to a second critique, by Acker and Bräutigam. Unlike what the authors of that critique claim, our data of Chinese loans to African countries is actually very similar to their own SAIS-CARI data. We also emphasize that our dataset at the country level has been publicly available online for 9 months. 1. Despite using loan commitments, our numbers are lower than official numbers and estimates by other researchers, including from a recent World Bank survey.Since reliable disbursement data is not available for the large majority of countries, our data, like those of others, are indeed based on (adjusted) commitments. When disbursements fall short of commitments, this can lead to an overestimation of outstanding debts. We were well aware of this challenge and have used any available information to address it in our research.
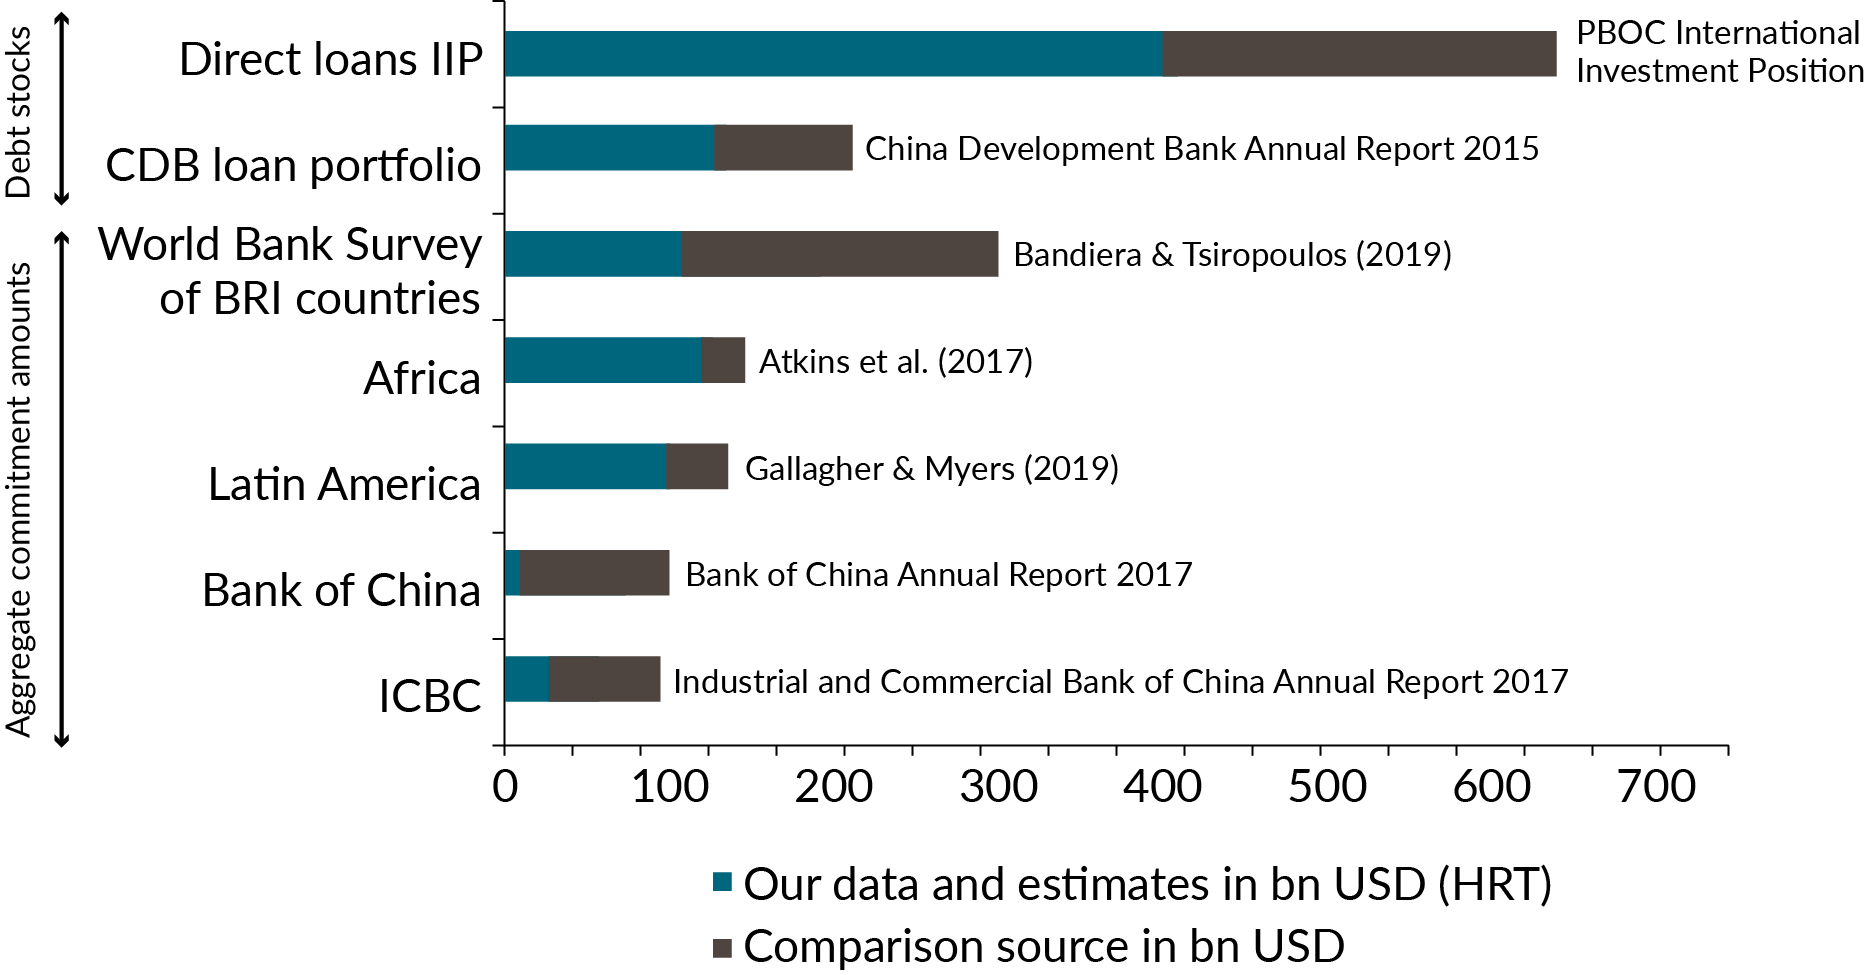
Figure 2 summarizes these benchmarking exercises, which we also discuss in the latest draft revision of our paper. As shown in the figure, our numbers are substantially below comparison figures and likely a lower bound estimate of the true extent of Chinese overseas lending. First, our estimated debt stocks are lower than the few available official numbers we can compare to. As of end-2017, the aggregate data from the People’s Bank of China on China’s International Investment Position showed outstanding overseas lending claims of US$637 billion. This is more than 50 percent higher than our aggregated debt stock estimate for end-2017, which is close to US$400 billion. In another example, China Development Bank, in its 2015 report, reported outstanding overseas loans of US$210 billion, of which we only capture US$127 billion (by adding up all debts to this creditor). Our numbers on commitments are also considerably below those reported by state-owned but commercial creditor banks such as Bank of China and Industrial and Commercial Bank of China, which have become large overseas creditors in recent years but for which very little systematic data collection exists. Second, our lending data is also lower than those of other researchers and policy institutions who focus on individual regions. For example, Figure 3 shows that our aggregate commitment numbers of Chinese loans to Africa and Latin America are lower than the aggregates reported by the widely used scholarly databases by SAIS CARI (Africa database by Atkins et al. 2017) and the Inter-American Dialogue (Latin American database by Gallagher and Myers 2019), respectively. Third, we get much lower numbers when comparing our loan data to the lending estimates from a recent World Bank survey on lending to Belt and Road countries (BRI) as reported by Bandiera and Tsiropoulos (2019). They estimate a total of US$300 billion in public and publicly guaranteed Chinese loan finance to the 50 BRI countries in the survey (between 2013 and 2018). In comparison, we identify only US$105 billion for those same countries and a slightly shorter time span (2013 to 2017). We conclude from these comparisons that our estimates are not too high, as suggested in the IMF/WB report, and if anything, they are too low. Despite our best efforts to merge data from multiple sources, we still miss substantial amounts of Chinese overseas lending. Figure 2. Our numbers are lower than official figures and those by other researchers
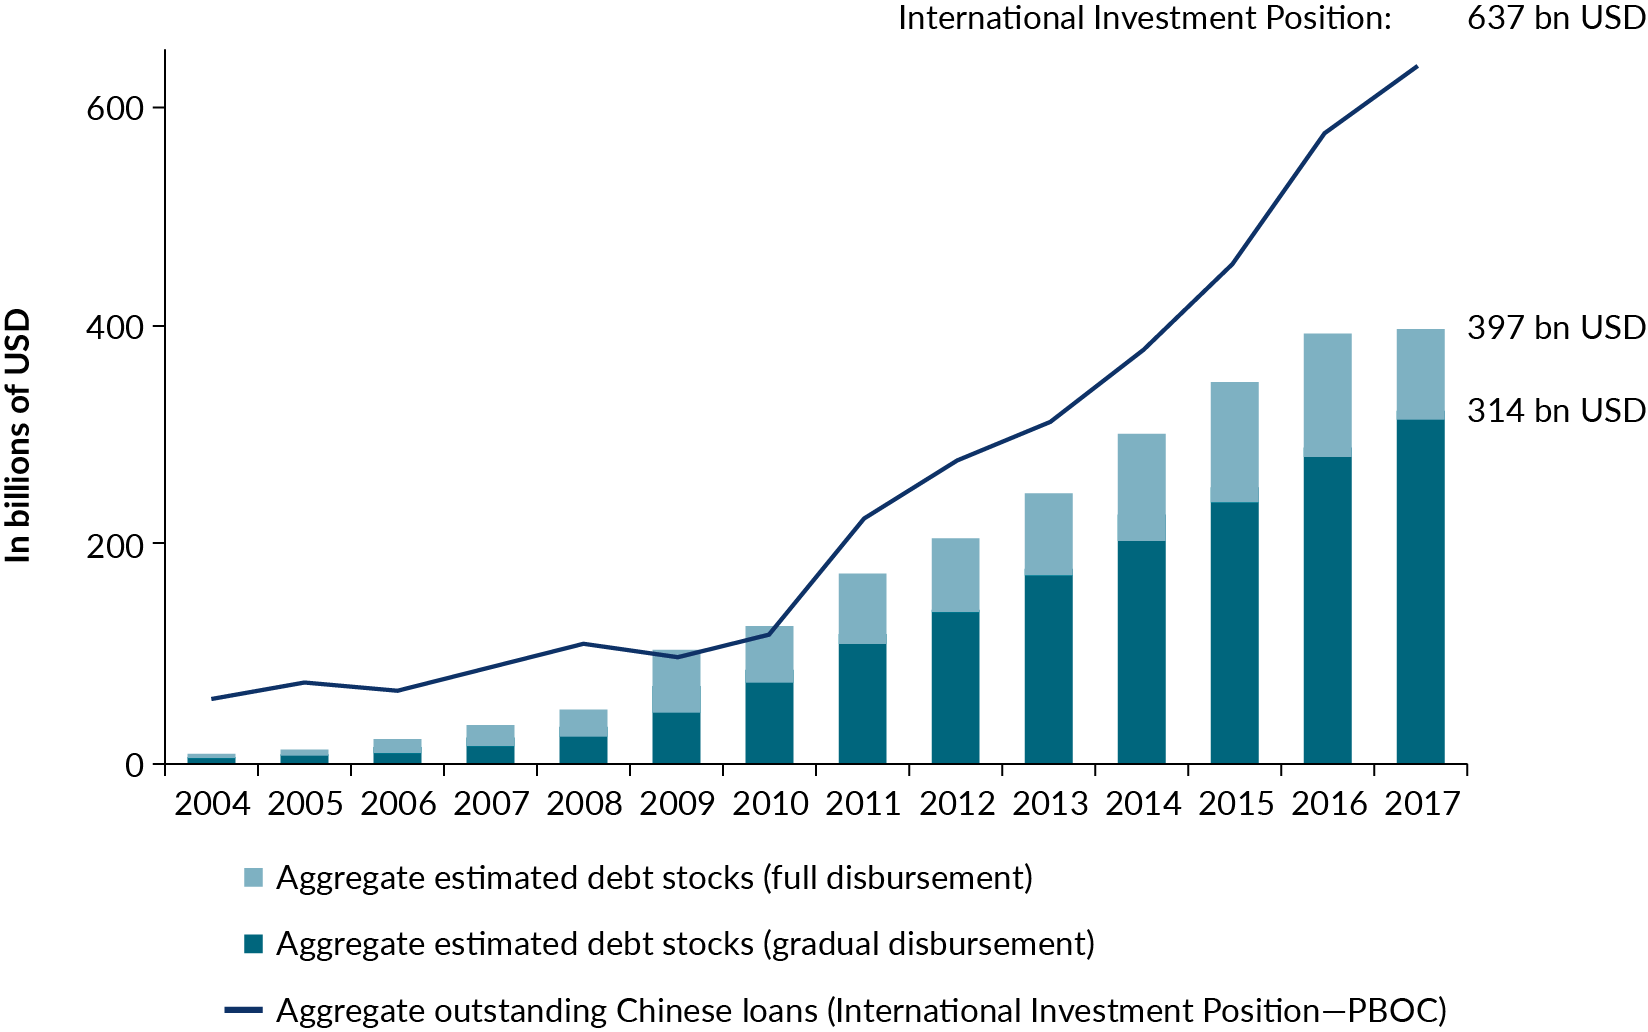
Note: This figure compares our debt stock estimates and loan data to official benchmarks and the work of other researchers. The PBOC International Investment Position shows total outstanding loan claims on non-residents. The CDB’s annual report shows outstanding overseas loans. We compare the 2015 figure since this number was no longer made public for 2016 or 2017. Bandiera & Tsiropoulos (2019) provide an estimate of Chinese public and publicly guaranteed finance to 50 Belt and Road countries between 2013 and 2018. SAIS CARI (Atkins et al. 2017) tracks Chinese lending commitments to governments and state-owned enterprises in Africa between 2000 and 2017. The Inter-American Dialogue (Gallagher & Myers 2019) tracks Chinese lending commitments to Latin American governments and public enterprises since 2005 (we exclude their data collection for 2018 and 2019 from the comparison, since our own data ends in 2017). Numbers for the Bank of China and the ICBC refer to credits extended to Belt and Road countries since 2015. Since no definition of Belt and Road countries is given in the BoC or ICBC annual report, we show our loan commitments for all countries in the sample. 2. Our identification of “hidden” Chinese lending is based on a direct comparison of commitment amounts and is therefore unaffected by shortfalls in disbursements.We do not identify hidden debt by comparing estimated debt stock to official debt figures. Instead, we conduct direct comparisons of our commitment data to the commitment amounts in the World Bank Debt Reporting System database. This means that our estimates of “hidden” Chinese lending are unaffected by potential shortfalls in disbursements. In other words, our estimates of “hidden” lending use an “apples to apples” comparison of our adjusted commitment estimates to the commitment numbers reported to the World Bank. We only count debt as unreported if there are underlying loan commitments that have not been reported. This way, we find that around 50 percent of Chinese overseas lending is not captured by official debt statistics. 3. The latest draft of our paper contains a sensitivity analysis of the commitment versus disbursement problem.The latest update to our 2019 paper contains a more detailed assessment on the commitment versus disbursement problem. In particular, we conduct a sensitivity analysis assuming that all loans are disbursed with a considerable time lag, distributed over the entire grace period of each loan (5 years on average). A summary of the results is shown in Figure 3, which plots our aggregated estimates on debt to China by more than 100 developing countries with and without sluggish disbursement (dark red and light red bars, respectively). As a benchmark, we also show PBoC data on the evolution of Chinese loans outstanding, as reported in the country’s International Investment Position (IIP, blue line). As shown in Figure 2 above, there is a wide gap between our estimated aggregate debts owed to China and the IIP data on Chinese overseas loan claims. Importantly, this gap gets even wider once we use the debt estimates with sluggish disbursements. Indeed, for 2017 that estimate is less than half the IIP number. This underlines the point we made above: While sluggish or incomplete disbursements can lead to an upward bias in debt stock estimates, the most serious concern is that we miss large portions of Chinese overseas lending, so that the overall bias is downward. Other researchers and organizations face the same challenge. Figure 3. Aggregate external debt stocks to China with and without sluggish disbursement
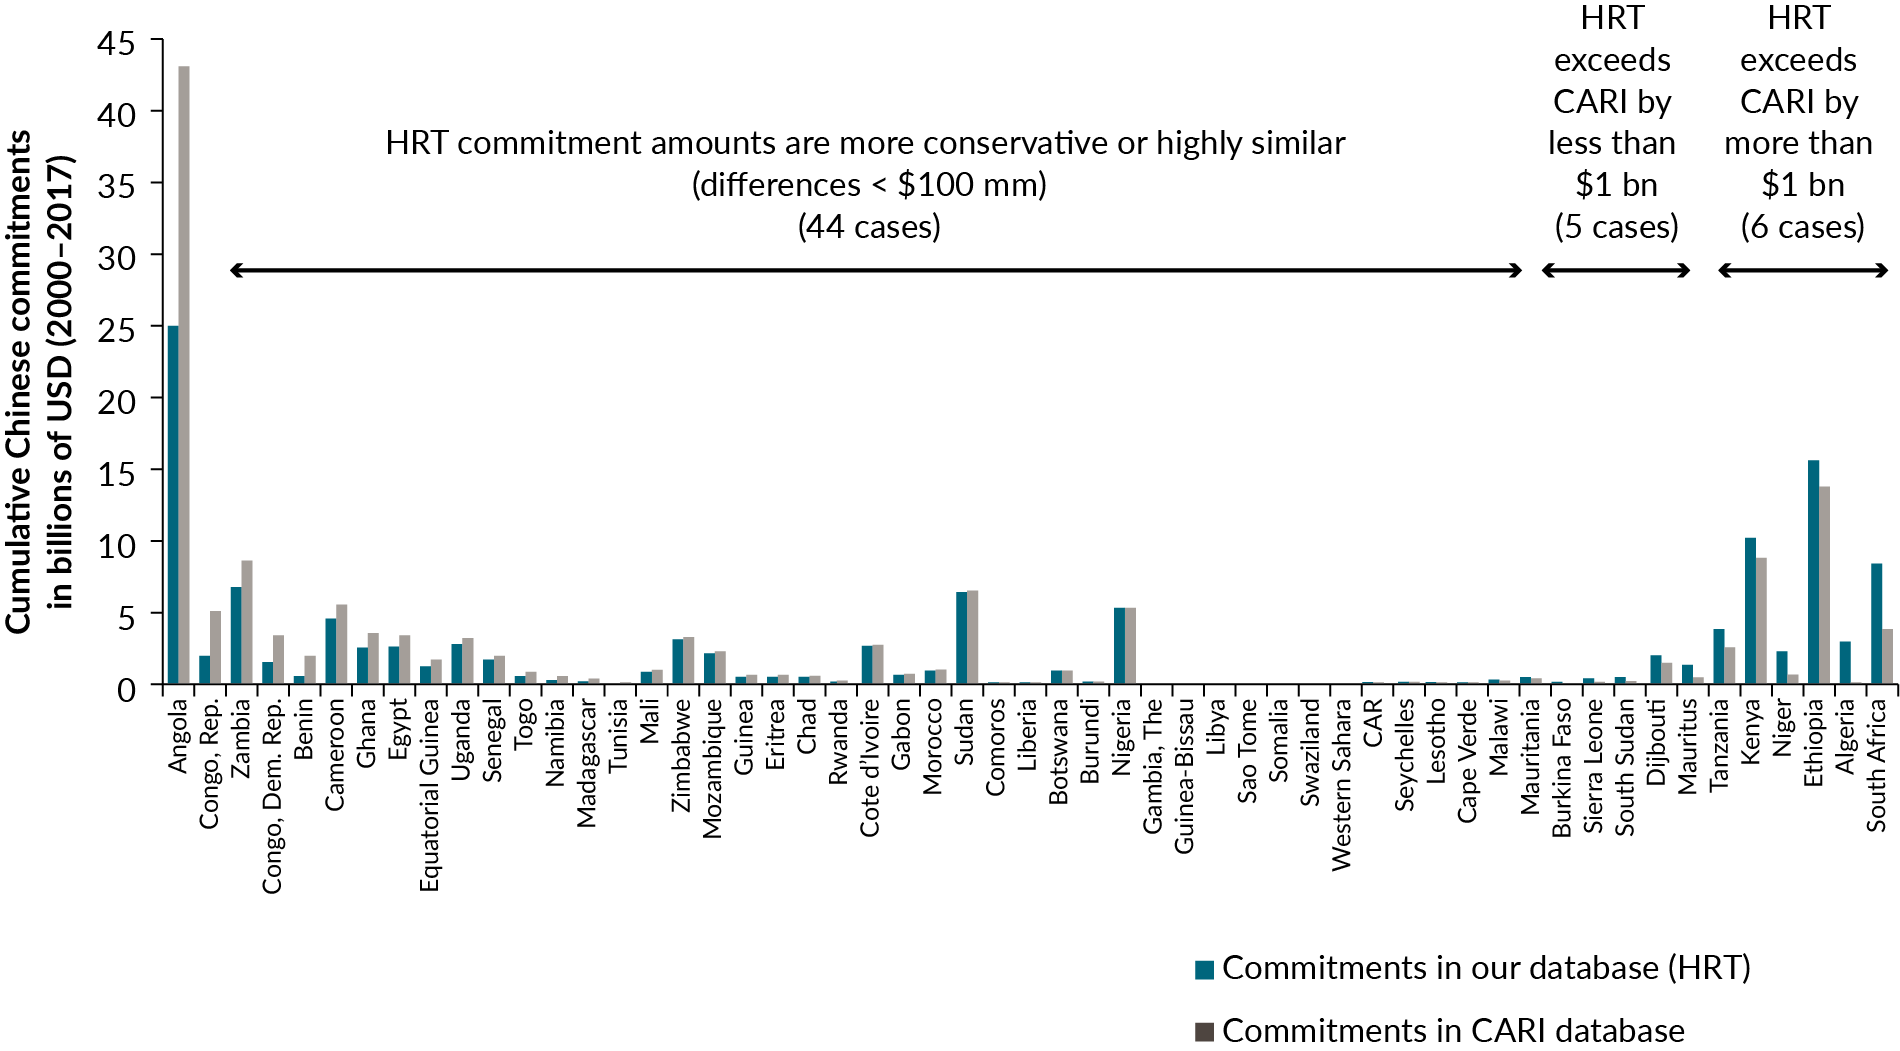
Note: This figure compares our estimated aggregate debts stocks per year (red bars, baseline) with estimates assuming sluggish disbursement (dark red bars, see sensitivity analysis above). The blue bold line shows total outstanding Chinese loan claims (on non-residents) as published by the PBoC in its International Investment Position. The comparison is based on our core sample of 107 countries, for which we have estimated debt stocks, but the numbers do not change substantially, if we look at an extended sample of 150 countries, for which we have collected loan data. 4. We are updating and improving our database constantlyWe are constantly updating and improving our database, and we welcome comments and suggestions. Over the course of the past months, we have made around a dozen corrections, sometimes adding loans that we had missed (e.g., in Caribbean countries) and sometimes dropping loans for which we found evidence that they were never or only partially disbursed. The latest version of our database—the China Debt Stock Database (Horn, Reinhart, and Trebesch 2020b)—with a detailed explanation of all improvements and corrections can be found on our websites (e.g., here). ReferencesAtkins, Lucas, Deborah Brautigam, Yuannan Chen, and Jyhjong Hwang. 2017. Challenges of and opportunities from the commodity price slump. CARI Economic Bulletin #1. Washington DC: China Africa Research Initiative. Brautigam, Deborah and Kevin Acker. 2020. Is China Hiding its Overseas Lending? Horn, Reinhart and Trebesch's "Hidden Loans" and Hidden Data. The China Africa Research Initiative Blog. Bandiera, Luca, and Vasileios Tsiropoulos. 2019. A Framework to Assess Debt Sustainability and Fiscal Risks under the Belt and Road Initiative. World Bank Policy Research Working Paper 8891. Bank of China. 2017. Annual Report. Beijing: BoC. China Development Bank. 2015. Annual Report. Beijing: CDB. Dreher, Axel, Andreas Fuchs, Bradley Parks, Austin M. Strange, and Michael J. Tierney. 2017. Aid, China, and Growth: Evidence from a New Global Development Finance Dataset. AidData Working Paper 46. Gallagher, Kevin P. and Margaret Myers. 2019. China-Latin America Finance Database. Washington DC: Inter-American Dialogue. Horn, Sebastian, Carmen M. Reinhart, and Christoph Trebesch. 2019. China's Overseas Lending. Kiel Working Paper No. 2132 – updated April 2020 ———2020. China Debt Stock Database. Available at https://sites.google.com/site/christophtrebesch/. Industrial and Commercial Bank of China. 2017. Annual Report. Beijing: ICBC. International Monetary Fund and World Bank. 2020. The Evolution of Public Debt Vulnerabilities in Lower Income Economies. Policy Paper No. 20/003. Washington DC: IMF and World Bank. People’s Bank of China. 2020. The time series data of International Investment Position of China. Beijing: SAFE. Appendix. A comparison with the SAIS CARI data on Chinese loans to AfricaWe have greatly benefitted from the work of Deborah Bräutigam and the China Africa Research Initiative at SAIS-CARI (e.g., Atkins et al. 2017). We use their data as an important input to our own database and regularly benchmarked our own estimates to their data during the course of our research. We were therefore surprised by a recent blog post by Acker and Bräutigam (2020) which contains a harsh critique of our data and findings. They suggest “that nearly half of [our] Africa data is flawed, perhaps significantly so.” But in fact, our data is very similar to theirs, as we show below. They also suggest that we are “hiding” our data, even though our main dataset has been publicly available on the web for more than nine months. It seems that Acker and Bräutigam’s blog post is the result of several misunderstandings. First and most importantly, the core of their critique is based on a problematic comparison of our debt/GDP data with their own total debt commitment data (in USD terms, i.e., not scaled to GDP). This is obviously an “apples to oranges” comparison. Specifically, Acker and Bräutigam conduct a comparison using one of our appendix graphs (rather than using the graphs in the main paper or our publicly available dataset). Based on that graph they then compare our ranking of Chinese lending to African countries (in percent of GDP) to their own ranking (in US dollar terms) and find “sharp discrepancies” between the rankings. This is no surprise given that the two series capture very different things (ratio versus stock). A more careful comparison reveals that our data for Africa is in fact very similar. To show this, Figure A1 compares aggregate loan commitments to African countries in our database to the commitments reported in the CARI database. Both series are given in nominal US dollars and cumulated for all years 2000-2017. For 80 percent of African countries (44 sovereigns) our lending data is lower or almost identical to the SAIS-CARI database (in 23 countries the differences are minimal, i.e., lower than US$100 million for aggregate commitments between 2000 and 2017). There are only 11 cases where commitments we identify in our paper exceed commitments in the SAIS-CARI database by more than US$100 million. The differences in three of these cases (Niger, Algeria, and South Africa) are simply a reflection of the fact that in our benchmark data collection we aim to collect both lending to private and public recipients. In Kenya and Djibouti, the differences are explained by updates in SAIS CARI data that are not (yet) reflected in our database. In the remaining countries, such as in Sierra Leone, South Sudan, and Ethiopia, our estimates are higher because they include loans that were confirmed by research teams at William & Mary AidData and / or the BU China Energy Finance database. Figure A1. Comparing our Chinese loan data to the SAIS CARI data, aggregate commitments to 55 African countries 2000-2017
Second, Acker and Bräutigam fail to mention that we have made our country-level dataset publicly available along with the publication of the working paper. Indeed, we do not understand why they focus so much on one of our appendix graphs, instead of downloading our database, which has been accessible on our websites since August 2019 (e.g. here) and which we have shared with everyone who contacted us. In fact, the data structure and level of disaggregation of our database is very similar to the data they themselves have released on their website. The Acker and Bräutigam critique also contains a detailed data example on Nigerian debt to China. The Nigeria comparison they refer to was reported in a recent Wall Street Journal article, but not in our paper. Indeed, we would like to emphasize that nowhere in the paper do we show hidden debt estimates for individual countries, neither for Nigeria nor for any other sovereign. Furthermore, and as we discuss above, our identification of unreported lending and debt is based on a comparison of commitment amounts and is thus not subject to the commitment versus disbursement problem. That said, we found the “Technical Appendix” of their blog entry helpful and appreciate the pointer to the data of the Nigerian Debt Management Office that is one of the very few sources reporting detailed disbursement data. In response, we have downward adjusted our estimate of Nigerian debt to China by 2.6 billion (0.7 percent of Nigerian GDP). Our database, with a detailed explanation of improvements and corrections, can be found here. Sebastian Horn is a research associate at the Kiel Institute for the World Economy. Carmen M. Reinhart is the Minos A. Zombanakis Professor of the International Financial System at Harvard Kennedy School. Christoph Trebesch is a professor at the Kiel Institute for the World Economy and a research affiliate at the Centre for Economic Policy Research. |
| URL | 查看原文 |
| 来源平台 | Canadian Institute of Mining, Metallurgy and Petroleum |
| 文献类型 | 新闻 |
| 条目标识符 | http://119.78.100.173/C666/handle/2XK7JSWQ/272487 |
| 专题 | 地球科学 |
| 推荐引用方式 GB/T 7714 | admin. China’s Overseas Lending: A Response to Our Critics. 2020. |
| 条目包含的文件 | 条目无相关文件。 | |||||
| 个性服务 |
| 推荐该条目 |
| 保存到收藏夹 |
| 查看访问统计 |
| 导出为Endnote文件 |
| 谷歌学术 |
| 谷歌学术中相似的文章 |
| [admin]的文章 |
| 百度学术 |
| 百度学术中相似的文章 |
| [admin]的文章 |
| 必应学术 |
| 必应学术中相似的文章 |
| [admin]的文章 |
| 相关权益政策 |
| 暂无数据 |
| 收藏/分享 |
除非特别说明,本系统中所有内容都受版权保护,并保留所有权利。


修改评论