Global S&T Development Trend Analysis Platform of Resources and Environment
| New map reveals landscape beneath Greenland’s ice sheet | |
| admin | |
| 2017-12-14 | |
| 发布年 | 2017 |
| 语种 | 英语 |
| 国家 | 英国 |
| 领域 | 资源环境 |
| 正文(英文) | A new map of what lies beneath the Greenland Ice Sheet is published this week (Thursday 14 December 2017). By providing scientists with the most comprehensive, high resolution and accurate picture of the bedrock and coastal seafloor, it reveals how the glaciers that drain from the Greenland Ice Sheet will contribute to future sea-level rise. Produced by researchers at British Antarctic Survey (BAS), University of Bristol and University of California at Irvine (UCI), the printed map is unveiled this week at the American Geophysical Union meeting in New Orleans. 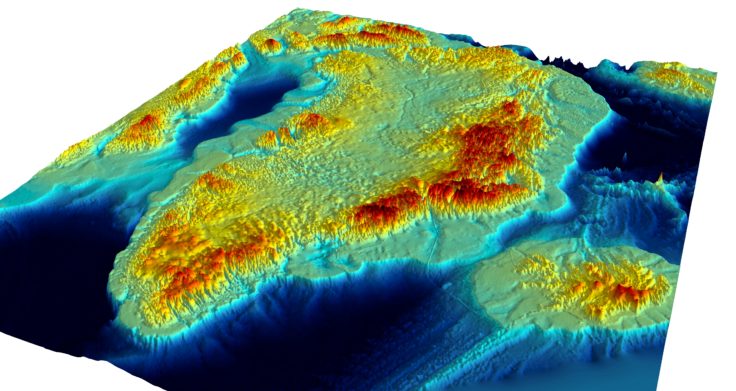 “Greenland Basal Topography BedMachine v3” is the new 1:3,500,000 scale map created from data collected by over 30 institutions.
The data required to compile the map was collected from many sources – from satellite, airborne and ground-based radar and seabed mapping from research ships.
ENDS Issued by the Press Office at British Antarctic Survey: Athena Dinar, Senior PR & Communications Manager, British Antarctic Survey, tel: +44 (0)1223 221 441; mobile: +44 (0)7909 008516; email: [email protected] Notes to Editors Images and fly-throughs of the map and fieldwork on and around Greenland are available from the BAS Press Office (above). The map “Greenland Basal Topography BedMachine v3”’ was funded through a grant from the Natural Environment Research Council via University of Bristol. It was co-produced by Chris Williams (now at British Geological Survey) and Peter Fretwell at BAS. This new product provides for the first time the whole periphery of Greenland and its coastline up to 50kms. The printed map is based on newly published data from an international consortium of over 30 research institutions. BedMachine v3: Complete bed topography and ocean bathymetry mapping of Greenland from multi-beam echo sounding combined with mass conservation by Morlighem, M., C. Williams, E. Rignot, L. An, J. E. Arndt, J. Bamber, G. Catania, N. Chauché, J. A. Dowdeswell, B. Dorschel, I. Fenty, K. Hogan, I. Howat, A. Hubbard, M. Jakobsson, T. M. Jordan, K. K. Kjeldsen, R. Millan, L. Mayer, J. Mouginot, B. Noël, C. O’Cofaigh, S. J. Palmer, S. Rysgaard, H. Seroussi, M. J. Siegert, P. Slabon, F. Straneo, M. R. van den Broeke, W. Weinrebe, M. Wood, and K. Zinglersen. 2017 was published in Geophysical Research Letters. 44. http://dx.doi.org/10.1002/2017GL074954 Data can be downloaded from: https://nsidc.org/data/IDBMG4 The map can be purchased from: www.stanfords.co.uk
|
| URL | 查看原文 |
| 来源平台 | British Antarctic Survey |
| 文献类型 | 新闻 |
| 条目标识符 | http://119.78.100.173/C666/handle/2XK7JSWQ/233813 |
| 专题 | 资源环境科学 |
| 推荐引用方式 GB/T 7714 | admin. New map reveals landscape beneath Greenland’s ice sheet. 2017. |
| 条目包含的文件 | 条目无相关文件。 | |||||
| 个性服务 |
| 推荐该条目 |
| 保存到收藏夹 |
| 查看访问统计 |
| 导出为Endnote文件 |
| 谷歌学术 |
| 谷歌学术中相似的文章 |
| [admin]的文章 |
| 百度学术 |
| 百度学术中相似的文章 |
| [admin]的文章 |
| 必应学术 |
| 必应学术中相似的文章 |
| [admin]的文章 |
| 相关权益政策 |
| 暂无数据 |
| 收藏/分享 |
除非特别说明,本系统中所有内容都受版权保护,并保留所有权利。


修改评论