Global S&T Development Trend Analysis Platform of Resources and Environment
| EIA introduces interactive dashboard detailing natural gas storage activity | |
| admin | |
| 2018-09-13 | |
| 发布年 | 2018 |
| 语种 | 英语 |
| 国家 | 美国 |
| 领域 | 地球科学 |
| 正文(英文) |  U.S. ENERGY INFORMATION ADMINISTRATION
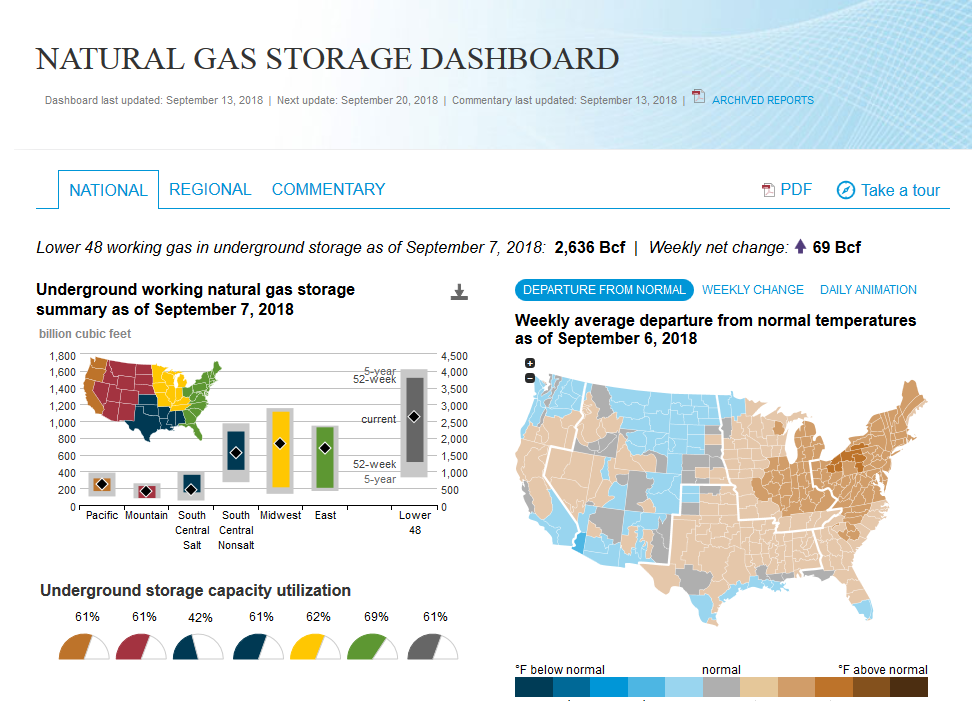
FOR IMMEDIATE RELEASE EIA introduces interactive dashboard detailing natural gas storage activityToday the U.S. Energy Information Administration (EIA) released a new interactive Natural Gas Storage Dashboard with daily and weekly information that provides a broader context to the data released in EIA’s Weekly Natural Gas Storage Report (WNGSR). The new dashboard gives users a comprehensive way to identify Lower 48 and regional storage activity and the key market fundamentals that affect underground natural gas storage activity. The WNGSR is one of the U.S. government's Principal Federal Economic Indicators. Most of these indicators, which include metrics like employment, international trade, housing construction, and crop production, are released on a quarterly or monthly basis. EIA will post updates to the dashboard in the mid-afternoon on the same days EIA releases its latest weekly natural gas storage estimates, which are usually on Thursdays. The dashboard will follow the same holiday reporting schedule as the WNGSR.
The dashboard includes the Lower 48 and regional natural gas storage inventories, net inventory changes, and utilization indicators. Other metrics include temperature visualizations, estimated natural gas consumption by sector, net exports, and futures prices. Information sources used reflect a combination of EIA and third-party data. Key sources of non-EIA data include temperature data from the National Oceanic and Atmospheric Administration (NOAA), natural gas demand and import/export data from OPIS PointLogic, and natural gas futures prices from CME Group and Bloomberg. EIA has incorporated many interactive features into the dashboard, such as the ability to select national or regional information, choose specific years or ranges, animate trends, and download selected data series or images. In addition to the data visualizations, the commentary tab will provide more context on recent natural gas storage-related market conditions. These entries will focus on many aspects of the natural gas storage market, such as potential drivers of changes in storage inventories, occasional details on EIA-derived storage statistics, and trends on natural gas storage infrastructure. The Natural Gas Storage Dashboard can be found at:
The product described in this press release was prepared by the U.S. Energy Information Administration (EIA), the statistical and analytical agency within the U.S. Department of Energy. By law, EIA’s data, analysis, and forecasts are independent of approval by any other officer or employee of the United States Government. The views in the product and press release therefore should not be construed as representing those of the Department of Energy or other federal agencies.
EIA Program Contact: Chris Peterson, 202-586-4804, Christopher.Peterson@eia.gov EIA Press Contact: Jonathan Cogan, 202-586-8719, Jonathan.Cogan@eia.gov EIA-2018-06 |
| URL | 查看原文 |
| 来源平台 | U.S. Energy Information Administration |
| 文献类型 | 新闻 |
| 条目标识符 | http://119.78.100.173/C666/handle/2XK7JSWQ/219068 |
| 专题 | 地球科学 |
| 推荐引用方式 GB/T 7714 | admin. EIA introduces interactive dashboard detailing natural gas storage activity. 2018. |
| 条目包含的文件 | 条目无相关文件。 | |||||
| 个性服务 |
| 推荐该条目 |
| 保存到收藏夹 |
| 查看访问统计 |
| 导出为Endnote文件 |
| 谷歌学术 |
| 谷歌学术中相似的文章 |
| [admin]的文章 |
| 百度学术 |
| 百度学术中相似的文章 |
| [admin]的文章 |
| 必应学术 |
| 必应学术中相似的文章 |
| [admin]的文章 |
| 相关权益政策 |
| 暂无数据 |
| 收藏/分享 |
除非特别说明,本系统中所有内容都受版权保护,并保留所有权利。


修改评论