Global S&T Development Trend Analysis Platform of Resources and Environment
| Kuroshio Enhances Bomb Cyclones- A mechanism to induce explosive cyclones and jet stream - | |
| admin | |
| 2017-01-21 | |
| 发布年 | 2017 |
| 语种 | 英语 |
| 国家 | 日本 |
| 领域 | 资源环境 |
| 正文(英文) |
Overview Dr. Akira Kuwano-Yoshida at Application Laboratory, the Japan Agency for Marine-Earth Science and Technology (JAMSTEC: Asahiko Taira, President) and Prof. Shoshiro Minobe at Hokkaido University (Keizo Yamaguchi, President) have found that Kuroshio enhances explosive extratropical cyclones called bomb cyclones*1 over the Northwestern Pacific. Based on atmospheric general circulation model (AGCM) experiments by the Earth Simulator supercomputer, scientists have examined atmospheric responses over the Kuroshio, Oyashio, and Kuroshio Extension. The results also present a mechanism that the concentrated explosive cyclone causes jet meandering over the Northeastern Pacific, which gives impacts on precipitation along the west coast of North America and Hawaii. Specifically, heat transported from the subtropics by Kuroshio becomes the energy of bomb cyclones, affecting atmospheric circulation and precipitation distribution over the Northeastern Pacific Ocean. These studies will advance understanding of global climate changes, roles of Kuroshio and Gulf Stream in the ocean-atmosphere interactions as well as improve reliability in experiments for climate prediction in mid-latitude climate zones. This work was supported by JSPS KAKENHI Grant Numbers 22106008. The above results were published in the online Journal of Climate issued by American Meteorological Society on January 21, 2017 (JST).
Title: Storm track response to SST fronts in the Northwestern Pacific region in an AGCM *1 Bomb cyclone is an extratropical cyclone that sees a drastic reduction in pressure of at least 24 millibars in 24 hours at 60° latitude, which can occur when an existing storm runs into another weather system and gains extra energy. In Tokyo (at 35°N), it refers to one with reduction of 16hPa or more in 24 hours. 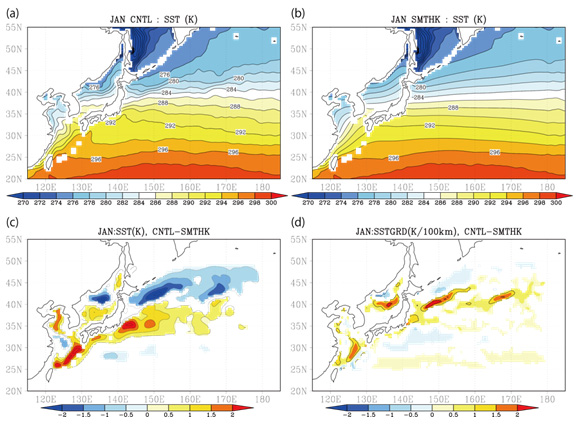 Figure 1. Climatological SSTs (sea surface temperature) in January for (a) one with 0.25-degree daily sea surface temperature data (CNTL) and (b) one with smoothed SSTs over an area covering SST fronts associated with the Kuroshio, the Oyashio, and the Kuroshio Extension and the subpolar front (SMTHK). 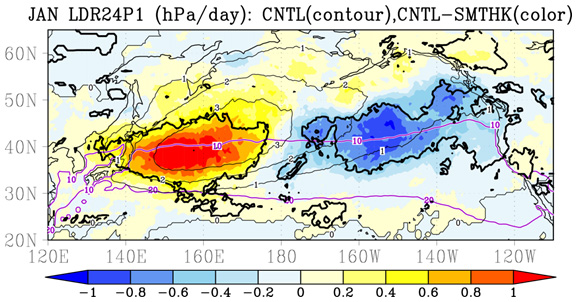 Figure 2. Explosive deepening events in January. Shown here are differences between CNTL and SMTHK (shown in shaded colors; unit: hPa/day) and climate data in CNTL (shown in thin solid lines). The purple line shows sea surface temperature of 10°C and 20°C. The black thick lines indicate areas where differences of explosive cyclone events are statistically significant. Explosive cyclone events are active when the warm color becomes strong and inactive when the cool color becomes strong in CNTL. 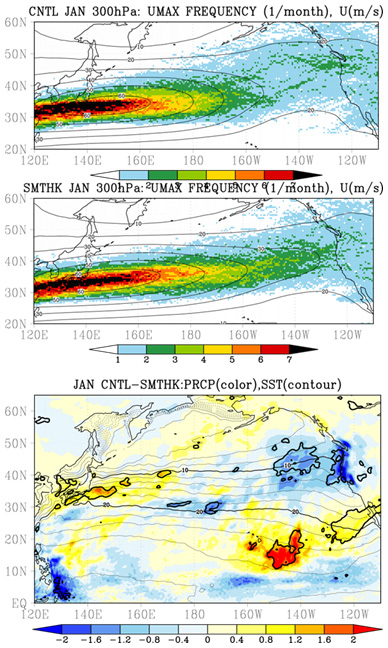 Figure 3. The figures (a) CNTL and (b) SMTHK show frequency of the jet axis at 300 hPa (shown in shaded colors) and monthly mean zonal velocity (shown in black solid lines; unit: m/s) in January. While the jet axis is diverged into north and south in the (a), it is concentrated on the axis on south. 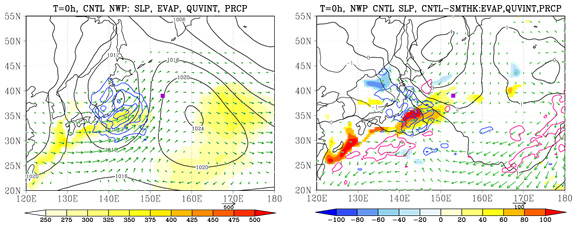 Figure 4. Composites for explosive deepening events in the Northwestern Pacific (153°E, 39°N;show in the purple square) showing sea level pressure (black lines; unit: hPa), vertically integrated moisture flux (green arrows; unit: mm m/s), precipitation (blue and purple lines; unit: mm/day) and surface latent heat flux (shaded colors; unit: W/m2). The a) shows CNTL and b) differences between CNTL and SMTHK. When the warm colors become stronger, the surface evaporation increases in CNTL. The blue lines indicate heavier precipitation in CNTL while the purple lines less precipitation. The arrows show the flow of horizontal direction of moisture. 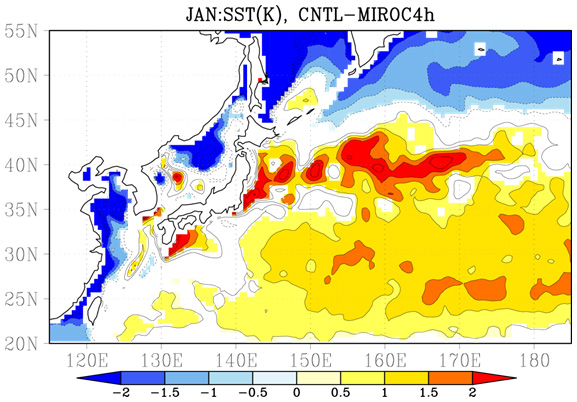 Figure 5. SST difference (unit: K) in January averaged from 1982 to 2001 between CNTL and the climate model MIROC4h. 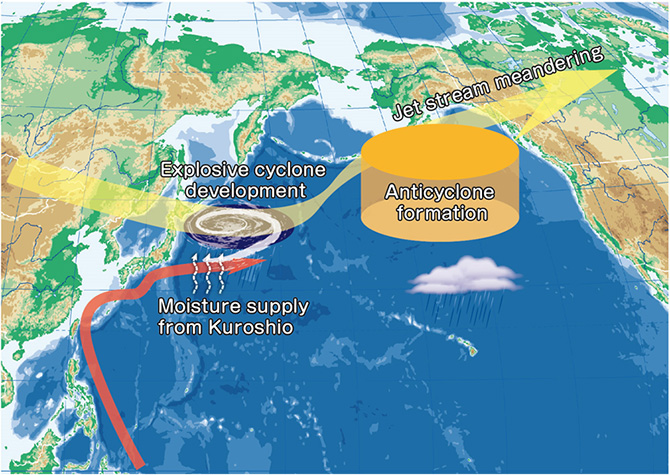 Figure 6. Diagram showing how Kuroshio gives impact on bomb cyclones and atmospheric general circulation. Contacts:
|
| URL | 查看原文 |
| 来源平台 | Japan Agency for Marine-Earth Science and Technology |
| 文献类型 | 新闻 |
| 条目标识符 | http://119.78.100.173/C666/handle/2XK7JSWQ/104352 |
| 专题 | 资源环境科学 |
| 推荐引用方式 GB/T 7714 | admin. Kuroshio Enhances Bomb Cyclones- A mechanism to induce explosive cyclones and jet stream -. 2017. |
| 条目包含的文件 | 条目无相关文件。 | |||||
| 个性服务 |
| 推荐该条目 |
| 保存到收藏夹 |
| 查看访问统计 |
| 导出为Endnote文件 |
| 谷歌学术 |
| 谷歌学术中相似的文章 |
| [admin]的文章 |
| 百度学术 |
| 百度学术中相似的文章 |
| [admin]的文章 |
| 必应学术 |
| 必应学术中相似的文章 |
| [admin]的文章 |
| 相关权益政策 |
| 暂无数据 |
| 收藏/分享 |
除非特别说明,本系统中所有内容都受版权保护,并保留所有权利。


修改评论